The content of this website is no longer being updated. For information on current assessment activities, please visit http://www.globalchange.gov/what-we-do/assessment
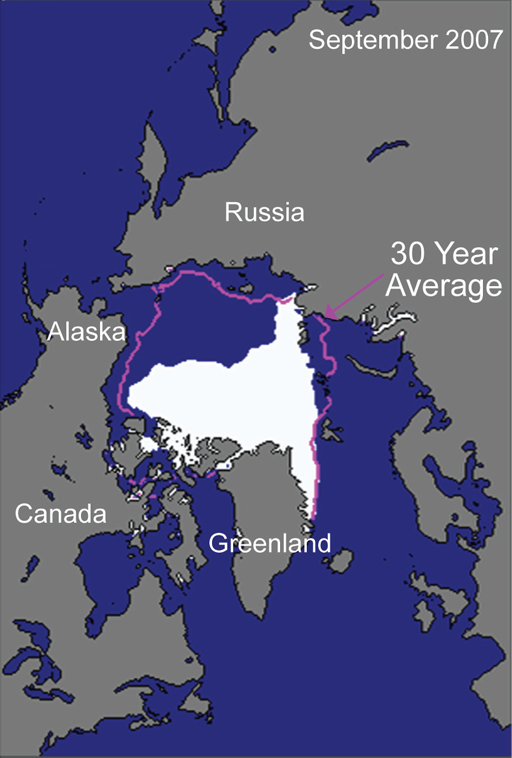
Arctic Sea Ice Decline

The pink line shows the average September sea ice extent from 1979 through the present. The white area shows September 2007 sea ice extent. In 2008, the extent was slightly larger than 2007, but the ice was thinner, resulting in a lower total volume of sea ice. In addition, recent years have had less ice that persisted over numerous years and more first-year ice, which melts more quickly.1 Image Reference: NSIDC1
References
- 1. a. b. [139] Fetterer, F., K. Knowles, W. Meier, and M. Savoie. Sea Ice Index - National Snow and Ice Data Center. Boulder, CO, 2002.
Summary
| High-resolution | High-resolution JPEG |
|---|