The content of this website is no longer being updated. For information on current assessment activities, please visit http://www.globalchange.gov/what-we-do/assessment
Human Health
Key Messages:
- Increases in risk of illness and death related to extreme heat and heat waves are very likelyat least a 90% chance of occurring. Some reduction in the risk of death related to extreme cold is expected.
- Warming is likely to make it more challenging to meet air quality standards necessary to protect public health.
- Extreme weather events cause physical and mental health problems. Some of these events are projected to increase.
- Some diseases transmitted by food, water, and insects are likelyat least two-thirds chance of occurring to increase.
- Rising temperature and carbon dioxide concentration increase pollen production and prolong the pollen season in a number of plants with highly allergenic pollen, presenting a health risk.
- Certain groups, including children, the elderly, and the poor, are most vulnerable to a range of climate-related health effects.
Hazard-Related Deaths in the U.S.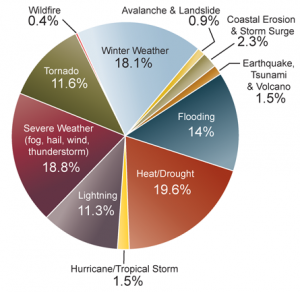 The pie chart shows the distribution of deaths for 11 hazard categories as a percent of the total 19,958 deaths due to these hazards from 1970 to 2004. Heat/drought ranks highest, followed by severe weather, which includes events with multiple causes such as lightning, wind, and rain.1 This analysis ended prior to the 2005 hurricane season which resulted in approximately 2,000 deaths.2 Image Reference: Borden and Cutter1Climate change poses unique challenges to human health. Unlike health threats caused by a particular toxin or disease pathogen, there are many ways that climate change can lead to potentially harmful health effects. There are direct health impacts from heat waves and severe storms, ailments caused or exacerbated by air pollution and airborne allergens, and many climate-sensitive infectious diseases.3
Realistically assessing the potential health effects of climate change must include consideration of the capacity to manage new and changing climate conditions.3 Whether or not increased health risks due to climate change are realized will depend largely on societal responses and underlying vulnerability. The probability of exacerbated health risks due to climate change points to a need to maintain a strong public health infrastructure to help limit future impacts.3
Increased risks associated with diseases originating outside the United States must also be considered because we live in an increasingly globalized world. Many poor nations are expected to suffer even greater health consequences from climate change.4 With global trade and travel, disease flare-ups in any part of the world can potentially reach the United States. In addition, weather and climate extremes such as severe storms and drought can undermine public health infrastructure, further stress environmental resources, destabilize economies, and potentially create security risks both within the United States and internationally.5
Heat Waves and Cold Waves
Increases in the risk of illness and death related to extreme heat and heat waves are very likelyat least a 90% chance of occurring. Some reduction in the risk of death related to extreme cold is expected.
Projected Increase in Heat-Related Deaths in Chicago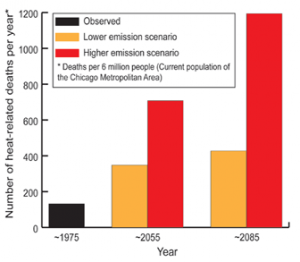 Increases in heat-related deaths are projected in cities around the nation, especially under higher emissions scenarios.6 This analysis included some, but not all possible, adaptation measures. The graph shows the projected number of deaths per year, averaged over a three-decade period around 1975, 2055, and 2085 for the City of Chicago under lower and higher emissions.6 Image Reference: Hayhoe et al.7
Temperatures are rising and the probability of severe heat waves is increasing. Analyses suggest that currently rare extreme heat waves will become much more common in the future (see National Climate Change).8 At the same time, the U.S. population is aging, and older people are more vulnerable to hot weather and heat waves. The percentage of the U.S. population over age 65 is currently 12 percent and is projected to be 21 percent by 2050 (over 86 million people).3,9 Diabetics are also at greater risk of heat-related death, and the prevalence of obesity and diabetes is increasing. Heat-related illnesses range from heat exhaustion to kidney stones.10,11
Heat is already the leading cause of weather-related deaths in the United States. More than 3,400 deaths between 1999 and 2003 were reported as resulting from exposure to excessive heat.12 An analysis of nine U.S. cities shows that deaths due to heat increase with rising temperature and humidity.13 From the 1970s to the 1990s, however, heat-related deaths declined.14 This likely resulted from a rapid increase in the use of air conditioning. In 1978, 44 percent of households were without air conditioning, whereas in 2005, only 16 percent of the U.S. population lived without it (and only 3 percent did not have it in the South).15,16 With air conditioning reaching near saturation, a recent study found that the general decline in heat-related deaths seems to have leveled off since the mid-1990s.17
Number of Days over 100ºF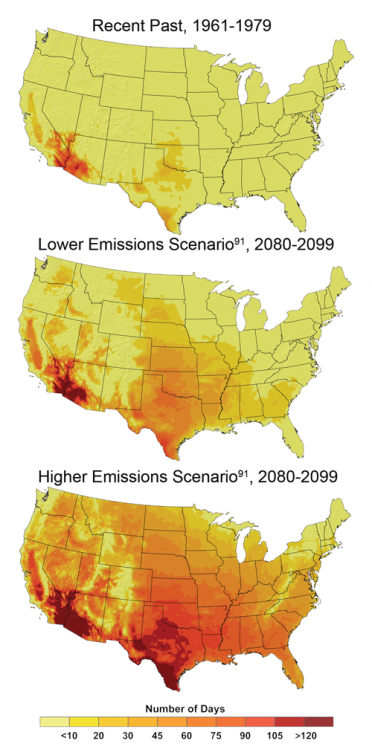 The number of days in which the temperature exceeds 100°F by late this century, compared to the 1960s and 1970s, is projected to increase strongly across the United States. For example, parts of Texas that recently experienced about 10 to 20 days per year over 100°F are expected to experience more than 100 days per year in which the temperature exceeds 100°F by the end of the century under the higher emissions scenario.6 Image Reference: CMIP3-B18As human-induced warming is projected to raise average temperatures by about 6 to 11°F in this century under a higher emissions scenario,6 heat waves are expected to continue to increase in frequency, severity, and duration.8,19 For example, by the end of this century, the number of heat-wave days in Los Angeles is projected to double,20 and the number in Chicago to quadruple,21 if emissions are not reduced.
Projections for Chicago suggest that the average number of deaths due to heat waves would more than double by 2050 under a lower emissions scenario6 and quadruple under a high emissions scenario6 (see figure above).7
A study of climate change impacts in California projects that, by the 2090s, annual heat-related deaths in Los Angeles would increase by two to three times under a lower emissions scenario and by five to seven times under a higher emissions scenario, compared to a 1990s baseline of about 165 deaths. These estimates assume that people will have become somewhat more accustomed to higher temperatures. Without such acclimatization, these estimates are projected to be about 20 to 25 percent higher.20
The full effect of global warming on heat-related illness and death involves a number of factors including actual changes in temperature (averages, highs, and lows); and human population characteristics, such as age, wealth, and fitness. In addition, adaptation at the scale of a city includes options such as heat wave early warning systems, urban design to reduce heat loads, and enhanced services during heat waves.3
Urban Heat Island Effect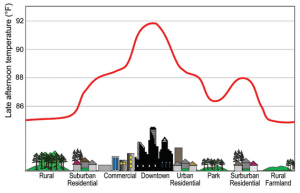 Large amounts of concrete and asphalt in cities absorb and hold heat. Tall buildings prevent heat from dissipating and reduce air flow. At the same time, there is generally little vegetation to provide shade and evaporative cooling. As a result, parts of cities can be up to 10ºF warmer than the surrounding rural areas, compounding the temperature increases that people experience as a result of human-induced warming.22 Image Reference: Lemmen and Warren23
Reduced extreme cold
In a warmer world, the number of deaths caused by extremely low temperatures would be expected to drop, although in general, it is uncertain how climate change will affect net mortality.3 Nevertheless, a recent study that analyzed daily mortality and weather data with regard to 6,513,330 deaths in 50 U.S. cities between 1989 and 2000 shows a marked difference between deaths resulting from hot and cold temperatures. The researchers found that, on average, cold snaps increased death rates by 1.6 percent, while heat waves triggered a 5.7 percent increase in death rates.24 The analysis found that the reduction in deaths as a result of relatively milder winters attributable to global warming will be substantially less than the increase in deaths due to summertime heat extremes.
Many factors contribute to winter deaths, including highly seasonal diseases such as influenza and pneumonia. It is unclear how these diseases are affected by temperature.3
Adaptation: Reducing Deaths During Heat Waves
In the mid-1990s, Philadelphia became the first U.S. city to implement a system for reducing the risk of death during heat waves. The city focuses its efforts on the elderly, homeless, and poor. During a heat wave, a heat alert is issued and news organizations are provided with tips on how vulnerable people can protect themselves. The health department and thousands of block captains use a buddy system to check on elderly residents in their homes; electric utilities voluntarily refrain from shutting off services for non-payment; and public cooling places extend their hours. The city operates a “Heatline” where nurses are standing by to assist callers experiencing health problems; if callers are deemed “at risk,” mobile units are dispatched to the residence. The city has also implemented a “Cool Homes Program” for elderly, low-income residents, which provides measures such as roof coatings and roof insulation that save energy and lower indoor temperatures. Philadelphia’s system is estimated to have saved 117 lives over its first 3 years of operation.25,26
Air Quality
Warming is likely to make it more challenging to meet air quality standards necessary to protect public health.
Temperature and Ozone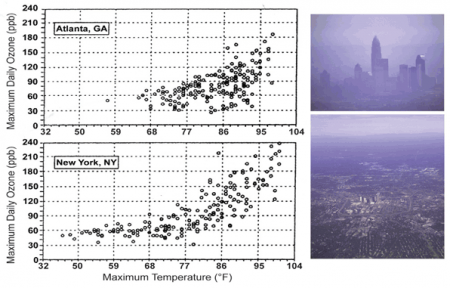 The graphs illustrate the observed association between ground-level ozone (a component of smog) concentration in parts per billion (ppb) and temperature in Atlanta and New York City (May to October 1988 to 1990).5 The projected higher temperatures across the United States in this century are likely to increase the occurrence of high ozone concentrations, although this will also depend on emissions of ozone precursors and meteorological factors. Ground-level ozone can exacerbate respiratory diseases and cause short-term reductions in lung function. Image Reference: NAST5Poor air quality, especially in cities, is a serious concern across the United States. Half of all Americans, 158 million people, live in counties where air pollution exceeds national health standards.27 While the Clean Air Act has improved air quality, higher temperatures and associated stagnant air masses are expected to make it more challenging to meet air quality standards, particularly for ground-level ozone (a component of smog).28 It has been firmly established that breathing ozone results in short-term decreases in lung function and damages the cells lining the lungs. It also increases the incidence of asthma-related hospital visits and premature deaths.4 Vulnerability to ozone effects is greater for those who spend time outdoors, especially with physical exertion, because this results in a higher cumulative dose to their lungs. As a result, children, outdoor workers, and athletes are at higher risk for these ailments.3
Projected Change in Ground-Level Ozone, 2090s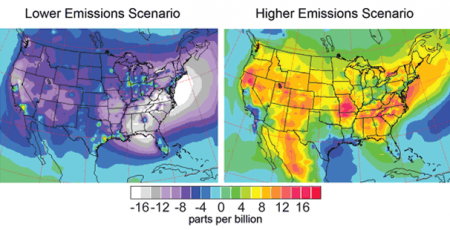 The maps show projected changes in ground-level ozone (a component of smog) for the 2090s, averaged over the summer months (June through August), relative to 1996-2000, under lower and higher emissions scenarios, which include both greenhouse gases and emissions that lead to ozone formation (some of which decrease under the lower emissions scenario).6 By themselves, higher temperatures and other projected climate changes would increase ozone levels under both scenarios. However, the maps indicate that future projections of ozone depend heavily on emissions, with the higher emissions scenario6 increasing ozone by large amounts, while the lower emissions scenario6 results in an overall decrease in ground-level ozone by the end of the century.29 Image Reference: Tao et al.29
Ground-level ozone concentrations are affected by many factors including weather conditions, emissions of gases from vehicles and industry that lead to ozone formation (especially nitrogen oxides and volatile organic compounds [VOCs]), natural emissions of VOCs from plants, and pollution blown in from other places.27,30 A warmer climate is projected to increase the natural emissions of VOCs, accelerate ozone formation, and increase the frequency and duration of stagnant air masses that allow pollution to accumulate, which will exacerbate health symptoms.31 Increased temperatures and water vapor due to human-induced carbon dioxide emissions have been found to increase ozone more in areas with already elevated concentrations, meaning that global warming tends to exacerbate ozone pollution most in already polluted areas. Under constant pollutant emissions, by the middle of this century, Red Ozone Alert Days (when the air is unhealthy for everyone) in the 50 largest cities in the eastern United States are projected to increase by 68 percent due to warming alone.31 Such conditions would challenge the ability of communities to meet health-based air quality standards such as those in the Clean Air Act.
Health risks from heat waves and air pollution are not necessarily independent. The formation of ground-level ozone occurs under hot and stagnant conditions – essentially the same weather conditions accompanying heat waves (see box in Society sector). Such interactions among risk factors are likelyat least two-thirds chance of occurring to increase as climate change continues.
Spotlight on Air Quality in California
Californians currently experience the worst air quality in the nation. More than 90 percent of the population lives in areas that violate state air quality standards for ground-level ozone or small particles. These pollutants cause an estimated 8,800 deaths and over a billion dollars in health care costs every year in California.32 Higher temperatures are projected to increase the frequency, intensity, and duration of conditions conducive to air pollution formation, potentially increasing the number of days conducive to air pollution by 75 to 85 percent in Los Angeles and the San Joaquin Valley, toward the end of this century, under a higher emissions scenario, and by 25 to 35 percent under a lower emissions scenario.33 Air quality could be further compromised by wildfires, which are already increasing as a result of warming.34,35
Adaptation: Improving Urban Air Quality
Because ground-level ozone is related to temperature (see Temperature and Ozone figure above), air quality is projected to become worse with human-induced climate change. Many areas in the country already have plans in place for responding to air quality problems. For example, the Air Quality Alert program in Rhode Island encourages residents to reduce air pollutant emissions by limiting car travel and the use of small engines, lawn mowers, and charcoal lighter fluids on days when ground-level ozone is high. Television weather reports include alerts when ground-level ozone is high, warning especially susceptible people to limit their time outdoors. To help cut down on the use of cars, all regular bus routes are free on Air Quality Alert days.36
Pennsylvania offers the following suggestions for high ozone days:
- Refuel vehicles after dark. Avoid spilling gasoline and stop fueling when the pump shuts off automatically.
- Conserve energy. Do not overcool homes. Turn off lights and appliances that are not in use. Wash clothes and dishes only in full loads.
- Limit daytime driving. Consider carpooling or taking public transportation. Properly maintain vehicles, which also helps to save fuel.
- Limit outdoor activities, such as mowing the lawn or playing sports, to the evening hours.
- Avoid burning leaves, trash, and other materials.
Traffic restrictions imposed during the 1996 summer Olympics in Atlanta quantified the direct respiratory health benefits of reducing the number of cars and the amount of their tailpipe emissions from an urban environment. Peak morning traffic decreased by 23 percent, and peak ozone levels dropped by 28 percent. As a result, childhood asthma-related emergency room visits fell by 42 percent.37
Extreme Events
Extreme weather events cause physical and mental health problems. Some of these events are projected to increase.
Injury, illness, emotional trauma, and death are known to result from extreme weather events.8 The number and intensity of some of these events are already increasing and are projected to increase further in the future.8,19 Human health impacts in the United States are generally expected to be less severe than in poorer countries where the emergency preparedness and public health infrastructure is less developed. For example, early warning and evacuation systems and effective sanitation lessen the health impacts of extreme events.8
This assumes that medical and emergency relief systems in the United States will function well and that timely and effective adaptation measures will be developed and deployed. There have already been serious failures of these systems in the aftermath of hurricanes Katrina and Rita, so coping with future impacts will require significant improvements.
Extreme storms
Over 2,000 Americans were killed in the 2005 hurricane season, more than double the average number of lives lost to hurricanes in the United States over the previous 65 years.3 But the human health impacts of extreme storms go beyond direct injury and death to indirect effects such as carbon monoxide poisoning from portable electric generators in use following hurricanes, an increase in stomach and intestinal illness among evacuees, and mental health impacts such as depression and post-traumatic stress disorder.3 Failure to fully account for both direct and indirect health impacts might result in inadequate preparation for and response to future extreme weather events.3
Floods
Heavy downpours have increased in recent decades and are projected to increase further as the world continues to warm.8,19 In the United States, the amount of precipitation falling in the heaviest 1 percent of rain events increased by 20 percent in the past century, while total precipitation increased by 7 percent. Over the last century, there was a 50 percent increase in the frequency of days with precipitation over 4 inches in the upper Midwest.19 Other regions, notably the South, have also seen strong increases in heavy downpours, with most of these coming in the warm season and almost all of the increase coming in the last few decades.
Heavy rains can lead to flooding, which can cause health impacts including direct injuries as well as increased incidence of waterborne diseases due to pathogens such as Cryptosporidium and Giardia.3 Downpours can trigger sewage overflows, contaminating drinking water and endangering beachgoers. The consequences will be particularly severe in the roughly 770 U.S. cities and towns, including New York, Chicago, Washington DC, Milwaukee, and Philadelphia, that have “combined sewer systems;” an older design that carries storm water and sewage in the same pipes.38 During heavy rains, these systems often cannot handle the volume, and raw sewage spills into lakes or waterways, including drinking-water supplies and places where people swim.34
In 1994, the Environmental Protection Agency (EPA) established a policy that mandates that communities substantially reduce or eliminate their combined sewer overflow, but this mandate remains unfulfilled.39 In 2004, the EPA estimated it would cost $55 billion to correct combined sewer overflow problems in publicly owned wastewater treatment systems.40
Using 2.5 inches of precipitation in one day as the threshold for initiating a combined sewer overflow event, the frequency of these events in Chicago is expected to rise by 50 percent to 120 percent by the end of this century,41 posing further risks to drinking and recreational water quality.
Wildfires
Wildfires in the United States are already increasing due to warming. In the West, there has been a nearly fourfold increase in large wildfires in recent decades, with greater fire frequency, longer fire durations, and longer wildfire seasons. This increase is strongly associated with increased spring and summer temperatures and earlier spring snowmelt, which have caused drying of soils and vegetation.3,34,35 In addition to direct injuries and deaths due to burns, wildfires can cause eye and respiratory illnesses due to fire-related air pollution.3
Pathogens
Some diseases transmitted by food, water, and insects are likelyat least two-thirds chance of occurring to increase.
A number of important disease-causing agents (pathogens) commonly transmitted by food, water, or animals are susceptible to changes in replication, survival, persistence, habitat range, and transmission as a result of changing climatic conditions such as increasing temperature, precipitation, and extreme weather events.3
- Cases of food poisoning due to Salmonella and other bacteria peak within one to six weeks of the highest reported ambient temperatures.3
- Cases of waterborne Cryptosporidium and Giardia increase following heavy downpours. These parasites can be transmitted in drinking water and through recreational water use.3
- Climate change affects the life cycle and distribution of the mosquitoes, ticks, and rodents that carry West Nile virus, equine encephalitis, Lyme disease, and hantavirus. However, moderating factors such as housing quality, land use patterns, pest control programs, and a robust public health infrastructure are likely to prevent the large-scale spread of these diseases in the United States.3,42
- Heavy rain and flooding can contaminate certain food crops with feces from nearby livestock or wild animals, increasing the likelihood of food-borne disease associated with fresh produce.3
- Vibrio sp. (shellfish poisoning) accounts for 20 percent of the illnesses and 95 percent of the deaths associated with eating infected shellfish, although the overall incidence of illness from Vibrio infection remains low. There is a close association between temperature, Vibrio sp. abundance, and clinical illness. The U.S. infection rate increased 41 percent from 1996 to 2006,3 concurrent with rising temperatures.
- As temperatures rise, tick populations that carry Rocky Mountain spotted fever are projected to shift from south to north.43
- The introduction of disease-causing agents from other regions of the world is an additional threat.3
While the United States has programs such as the Safe Drinking Water Act that help protect against some of these problems, climate change will present new challenges.
Spotlight on West Nile Virus
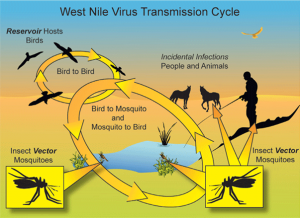 The first outbreak of West Nile virus in the United States occurred in the summer of 1999, likely a result of international air transport. Within five years, the disease had spread across the continental United States, transmitted by mosquitoes that acquire the virus from infected birds. While bird migrations were the primary mode of disease spread, during the epidemic summers of 2002 to 2004, epicenters of West Nile virus were linked to locations with either drought or above average temperatures.
Since 1999, West Nile virus has caused over 28,000 reported cases, and over 1,100 Americans have died from it.44 During 2002, a more virulent strain of West Nile virus emerged in the United States. Recent analyses indicate that this mutated strain responds strongly to higher temperatures, suggesting that greater risks from the disease may result from increases in the frequency of heatwaves,45 though the risk will also depend on the effectiveness of mosquito control programs.
While West Nile virus causes mild flu-like symptoms in most people, about one in 150 infected people develop serious illness, including the brain inflammation diseases encephalitis and meningitis.
Allergens
Rising temperature and carbon dioxide concentration increase pollen production and prolong the pollen season in a number of plants with highly allergenic pollen, presenting a health risk.
Pollen Counts Rise with Increasing Carbon Dioxide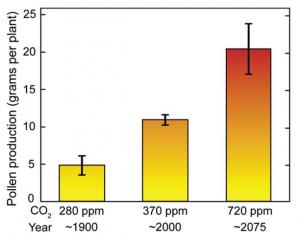 Pollen production from ragweed grown in chambers at the carbon dioxide concentration of a century ago (about 280 parts per million, ppm) was about 5 grams per plant; at today’s approximate carbon dioxide level, it was about 10 grams; and at a level projected to occur about 2075 under the higher emissions scenario,6 it was about 20 grams.46 Image Reference: Ziska and Caulfield46
Rising carbon dioxide levels have been observed to increase the growth and toxicity of some plants that cause health problems. Climate change has caused an earlier onset of the spring pollen season in the United States.4 It is reasonable to conclude that allergies caused by pollen have also experienced associated changes in seasonality.4 Several laboratory studies suggest that increasing carbon dioxide concentrations and temperatures increase ragweed pollen production and prolong the ragweed pollen season.3,4
 Poison IvyPoison ivy growth and toxicity is also greatly increased by carbon dioxide, with plants growing larger and more allergenic. These increases exceed those of most beneficial plants. For example, poison ivy vines grow twice as much per year in air with a doubled preindustrial carbon dioxide concentration as they do in unaltered air; this is nearly five times the increase reported for tree species in other analyses.47 Recent and projected increases in carbon dioxide also have been shown to stimulate the growth of stinging nettle and leafy spurge, two weeds that cause rashes when they come into contact with human skin.48,49
Vulnerable Populations
Certain groups, including children, the elderly, and the poor, are most vulnerable to a range of climate-related health effects.
Infants and children, pregnant women, the elderly, people with chronic medical conditions, outdoor workers, and people living in poverty are especially at risk from a variety of climate related health effects. Examples of these effects include increasing heat stress, air pollution, extreme weather events, and diseases carried by food, water, and insects.3
Children’s small ratio of body mass to surface area and other factors make them vulnerable to heat-related illness and death. Their increased breathing rate relative to body size, additional time spent outdoors, and developing respiratory tracts, heighten their sensitivity to air pollution. In addition, children’s immature immune systems increase their risk of serious consequences from waterborne and food-borne diseases, while developmental factors make them more vulnerable to complications from severe infections such as E. coli or Salmonella.3
The greatest health burdens related to climate change are likely to fall on the poor, especially those lacking adequate shelter and access to other resources such as air conditioning.3
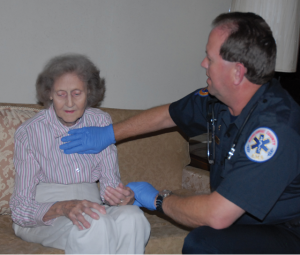 Elderly people are more likely to have debilitating chronic diseases or limited mobility. The elderly are also generally more sensitive to extreme heat for several reasons. They have a reduced ability to regulate their own body temperature or sense when they are too hot. They are at greater risk of heart failure, which is further exacerbated when cardiac demand increases in order to cool the body during a heat wave.50 Also, people taking medications, such as diuretics for high blood pressure, have a higher risk of dehydration.3
The multiple health risks associated with diabetes will increase the vulnerability of the U.S. population to increasing temperatures. The number of Americans with diabetes has grown to about 24 million people, or roughly 8 percent of the U.S. population. Almost 25 percent of the population 60 years and older had diabetes in 2007.51 Fluid imbalance and dehydration create higher risks for diabetics during heat waves. People with diabetes-related heart disease are at especially increased risk of dying in heat waves.50
High obesity rates in the United States are a contributing factor in currently high levels of diabetes. Similarly, a factor in rising obesity rates is a sedentary lifestyle and automobile dependence; 60 percent of Americans do not meet minimum daily exercise requirements. Making cities more walkable and bikeable would thus have multiple benefits: improved personal fitness and weight loss; reduced local air pollution and associated respiratory illness; and reduced greenhouse gas emissions.52
The United States has considerable capacity to adapt to climate change, but during recent extreme weather and climate events, actual practices have not always protected people and property. Vulnerability to extreme events is highly variable, with disadvantaged groups and communities (such as the poor, infirm, and elderly) experiencing considerable damage and disruptions to their lives. Adaptation tends to be reactive, unevenly distributed, and focused on coping rather than preventing problems. Future reduction in vulnerability will require consideration of how best to incorporate planned adaptation into long-term municipal and public service planning, including energy, water, and health services, in the face of changing climate-related risks combined with ongoing changes in population and development patterns.3,53
Geographic Vulnerability of U.S. Residents to Selected Climate-Related Health Impacts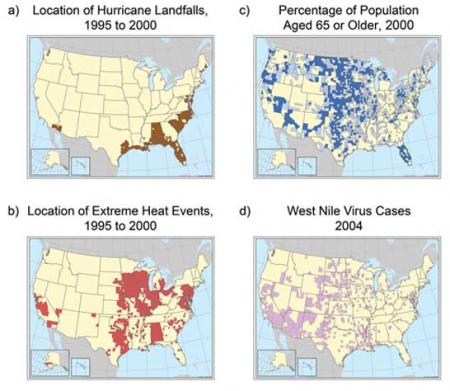 Maps indicating U.S. counties, or in some cases states, with existing vulnerability to climate-sensitive health outcomes: a) location of hurricane landfalls; b) extreme heat events (defined by the Centers for Disease Control as temperatures 10 or more degrees F above the average high temperature for the region and lasting for several weeks); c) percentage of population over age 65 (dark blue indicates that percentage is over 17.6 percent, light blue 14.4 to 17.5 percent); d) locations of West Nile virus cases reported in 2004. These examples demonstrate both the diversity of climate-sensitive health outcomes and the geographic variability of where they occur. Events over short time spans, in particular West Nile virus cases, are not necessarily predictive of future vulnerability. Image Reference: CCSP SAP 4.63
Primary Sources
References
- 1. a. b. [273] Borden, K. A., and S. L. Cutter. "Spatial Patterns of Natural Hazards Mortality in the United States." International Journal of Health Geographics 7 (2008): 13 pp.
- 2. [229] Center, NOAA's National Climatic Data. Billion Dollar U.S. Weather Disasters., 2008.
- 3. a. b. c. d. e. f. g. h. i. j. k. l. m. n. o. p. q. r. s. t. u. v. w. x. y. z. . . [163] Ebi, K. L., J. Balbus, P. L. Kinney, E. Lipp, D. M. Mills, M. S. O'Neill, and M. Wilson. "Effects of Global Change on Human Health." In Analyses of the Effects of Global Change on Human Health and Welfare and Human Systems, edited by J. L. Gamble, 39-87. Vol. Synthesis and Assessment Product 4.6. Washington, D.C.: U.S. Environmental Protection Agency, 2008.
- 4. a. b. c. d. e. [272] Confalonieri, U., B. Menne, R. Akhtar, K. L. Ebi, M. Hauengue, R. S. Kovats, B. Revich, and A. Woodward. "Human Health." In Climate Change 2007: Impacts, Adaptation and Vulnerability, edited by M. L. Parry, O. F. Canziani, J. P. Palutikof, P. J. van der Linden and C. E. Hanson, 391-431. Vol. Contribution of Working Group II to the Fourth Assessment Report of the Intergovernmental Panel on Climate Change. Cambridge, UK and New York, NY: Cambridge University Press, 2007.
- 5. a. b. c. [219] Team, National Assessment Synthesis. Climate Change impacts on the United States: The Potential Consequences of Climate Variability and Change. Cambridge, UK and New York, NY, 2001.
- 6. a. b. c. d. e. f. g. h. i. j. [91] various. footnote 91., 2009.
- 7. a. b. [283] Hayhoe, K., J. VanDorn, T. Croley III, N. Schlegal, and D. Wuebbles. "Regional Climate Change Projections for Chicago and the U.S. Great Lakes." Journal of Great Lakes Research 36, no. Supplement 2 (2010): 7-21.
- 8. a. b. c. d. e. f. [68] Gutowski, W. J., G. C. Hegerl, G. J. Holland, T. R. Knutson, L. Mearns, R. J. Stouffer, P. J. Webster, M. F. Wehner, and F. W. Zwiers. "Causes of Observed Changes in Extremes and Projections of Future Changes." In Weather and Climate Extremes in a Changing Climate: Regions of Focus: North America, Hawaii, Caribbean, and U.S. Pacific Islands, edited by T. R. Karl, G. A. Meehl, C. D. Miller, S. J. Hassol, A. M. Waple and W. L. Murray, 81-116. Vol. Synthesis and Assessment Product 3.3. Washington, D.C.: U.S. Climate Change Science Program, 2008.
- 9. [274] Gamble, J. L., K. L. Ebi, A. Grambsch, F. G. Sussman, T. J. Wilbanks, C. E. Reid, K. Hayhoe, J. V. Thomas, C. P. Weaver, and F. G. Sussman. "Introduction." In Analyses of the Effects of Global Change on Human Health and Welfare and Human Systems, edited by J. L. Gamble, 13-37. Vol. Synthesis and Assessment Product 4.6. Washington, D.C.: U.S. Environmental Protection Agency, 2008.
- 10. [275] Brikowski, T. H., Y. Lotan, and M. S. Pearle. "Climate-related Increase in the Prevalence of Urolithiasis in the United States." Proceedings of the National Academy of Sciences 105, no. 28 (2008): 9841-9846.
- 11. [276] Semenza, J. C.. "Acute Renal Failure During Heat Waves." American Journal of Preventive Medicine 17, no. 1 (1999): 97.
- 12. [277] Luber, G. E., and L. M. Conklin. "Heat-related Deaths: United States, 1999-2003." Morbidity and Mortality Weekly Report 55, no. 29 (2006): 796-798.
- 13. [278] Zanobetti, A., and J. Schwartz. "Temperature and Mortality in Nine U.S. Cities." Epidemiology 19, no. 4 (2008): 563-570.
- 14. [279] Davis, R. E., P. C. Knappenberger, P. J. Michaels, and W. M. Novicoff. "Changing Heat-related Mortality in the United States." Environmental Health Perspectives 111, no. 14 (2003): 1712-1718.
- 15. [280] Administration, Energy Information U. S.. Table HC10.6: Air Conditioning Characteristics by U.S. Census Region In 2005 Residential Energy Consumption Survey., 2005.
- 16. [281] Administration, Energy Information U. S.. Table 2: Type of Air Conditioning Equipment by Census Region and Survey Year In 2005 Residential Energy Consumption Survey., 2005.
- 17. [282] Sheridan, S. C., A. J. Kalkstein, and L. S. Kalkstein. "Trends in Heat-related Mortality in the United States, 1975-2004." Natural Hazards (2009): 145-160.
- 18. [117] various. footnote 117., 2009.
- 19. a. b. c. d. [112] Kunkel, K., P. D. Bromirski, H. E. Brooks, T. Cavazos, A. V. Douglas, D. R. Easterling, K. Emanuel, P.Ya. Groisman, G. J. Holland, T. R. Knutson et al. "Observed Changes in Weather and Climate Extremes." In Weather and Climate Extremes in a Changing Climate: Regions of Focus: North America, Hawaii, Caribbean, and U.S. Pacific Islands, edited by T. R. Karl, G. A. Meehl, C. D. Miller, S. J. Hassol, A. M. Waple and W. L. Murray, 35-80. Vol. CCSP Synthesis and Assessment Product 3.3. Washington, D.C.: U.S. Climate Change Science Program, 2008.
- 20. a. b. [284] Hayhoe, K., D. Cayan, CB Field, P. C. Frumhoff, E. P. Maurer, N. L. Miller, S. C. Moser, S. H. Schneider, K. N. Cahill, E. E. Cleland et al. "Emissions Pathways, Climate Change, and Impacts on California." Proceedings of the National Academy of Sciences 101, no. 34 (2004): 12422-12427.
- 21. [285] Vavrus, S., and J. VanDorn. "Projected Future Temperature and Precipitation Extremes in Chicago." Journal of Great Lakes Research 36, no. Supplement 2 (2010): 22-32.
- 22. [313] Wilbanks, T. J., P. Kirshen, D. Quattrochi, P. Romero-Lankao, C. Rosenzweig, M. Ruth, W. D. Solecki, J. Tarr, P. H. Larsen, and B. Stone. "Effects of Global Change on Human Settlements." In Analyses of the Effects of Global Change on Human health and Welfare and Human Systems, edited by J. L. Gamble, 89-109. Vol. Synthesis and Assessment Product 4.6. Washington, D.C.: U.S. Environmental Protection Agency, 2008.
- 23. [286] Climate Change Impacts and Adaptation: A Canadian Perspective, Edited by D. S. Lemmen and F. J. Warren. Ottawa, ON: Climate Change Impacts and Adaptation Program, Natural Resources Canada, 2004.
- 24. [289] Medina-Ramon, M., and J. Schwartz. "Temperature, Temperature Extremes, and Mortality: A Study of Acclimatisation and Effect Modification in 50 U.S. Cities." Occupational and Environmental Medicine 64, no. 12 (2007): 827-833.
- 25. [287] Ebi, K. L., J. Smith, I. Burton, and J. Scheraga. "Some Lessons Learned from Public Health on the Process of Adaptation." Mitigation and Adaptation Strategies for Global Change 11, no. 3 (2006): 607-620.
- 26. [288] Ebi, K. L., T. J. Teisberg, L. S. Kalkstein, L. Robinson, and R. F. Weiher. "Heat Watch/Warning Systems Save Lives - Estimated Costs and Benefits for Philadelphia 1995-98." Bulletin of the American Meteorological Society 85, no. 8 (2004): 1067-1073.
- 27. a. b. [290] EPA. National Air Quality:Status and Trends Through 2007. Research Triangle Park, NC: U.S. Environmental Protection Agency, Air Quality Assessment Division, 2008.
- 28. [13] Shindell, D., H. Levy II, A. Gilliland, M. D. Schwarzkopf, and L. W. Horowitz. "Climate Change from Short-Lived Emissions Due to Human Activites." In Climate Projections Based on Emissions Scenarios for Long-Lived and Short-Lived Radiatively Active Gases and Aerosols, edited by H. Levy II, D. Shindell, A. Gilliland, M. D. Schwarzkopf and L. W. Horowitz, 27-60. Vol. Synthesis and Assessment Product 3.2. Washington, D.C.: U.S. Climate Change Science Program, 2008.
- 29. a. b. [291] Tao, Z., A. Williams, H. - C. Huang, M. Caughey, and X. - Z. Liang. "Sensitivity of U.S. Surface Ozone to Future Emissions and Climate Changes." Geophysical Research Letters 34 (2007): L08811.
- 30. [297] Wuebbles, D. J., H. Lei, and J. - T. Lin. "Intercontinental Transport of Aerosols and Photochemical Oxidants from Asia and its Consequences." Environmental Pollution 150 (2007): 65-84.
- 31. a. b. [298] Bell, M. L., R. Goldberg, C. Hogrefe, P. L. Kinney, K. Knowlton, B. Lynn, J. Rosenthal, C. Rosenzweig, and J. A. Patz. "Climate Change, Ambient Ozone, and Health in 50 U.S. Cities." Climatic Change 82, no. 1-2 (2007): 61-76.
- 32. [292] Board, California Air Resources. Recent Research Findings: Health Effects of Particulate Matter and Ozone Air Pollution. Sacramento, CA: California Air Resources Board, 2007.
- 33. [293] Team, California Climate Action. Climate Action Team Report to Governor Schwarzenegger and the Legislature. Sacramento, CA: California Environmental Protection Agency, 2006.
- 34. a. b. c. [252] Peterson, T. C., D. M. Anderson, S. J. Cohen, M. Cortez-Vazquez, R. J. Murnane, C. Parmesan, D. Phillips, R. Pulwarty, and J. M. R. Stone. "Why Weather and Climate Extremes Matter." In Weather and Climate Extremes in a Changing Climate - Regions of Focus: North America, Hawaii, Caribbean, and U.S. Pacific Islands, edited by T. R. Karl, G. A. Meehl, C. D. Miller, S. J. Hassol, A. M. Waple and W. L. Murray, 11-34. Vol. Synthesis and Assessment Product 3.3. Washington, D.C.: U.S. Climate Change Science Program, 2008.
- 35. a. b. [294] Westerling, A. L., H. G. Hidalgo, D. R. Cayan, and T. W. Swetnam. "Warming and Earlier Spring Increase Western U.S. Forest Wildfire Activity." Science 313, no. 5789 (2006): 940-943.
- 36. [295] Authority, Rhode Island Public Transit. Air Quality Alert Days Program., Submitted.
- 37. [296] Friedman, M. S., K. E. Powell, L. Hutwagner, L. M. Graham, and W. G. Teague. "Impact of Changes in Transportation and Commuting Behaviors During the 1996 Summer Olympic Games in Atlanta on Air Quality and Childhood Asthma." Journal of the American Medical Association 285, no. 7 (2001): 897-905.
- 38. [299] Agency, Environmental Protection U. S.. National Pollutant Discharge Elimination System (NPDES) Combined Sewer Overflows Demographics., 2008.
- 39. [300] Tibbetts, J.. "Combined Sewer Systems: Down, Dirty, and Out of Date." Environmental Health Perspectives 113, no. 7 (2005): A464-A467.
- 40. [301] EPA. Clean Watersheds Needs Survey 2004: Report to Congress. Washington, D.C.: U.S. Environmental Protection Agency, 2008.
- 41. [302] Patz, J. A., S. J. Vavrus, C. K. Uejio, and S. L. McLellan. "Climate Change and Waterborne Disease Risk in the Great Lakes Region of the U.S." American Journal of Preventive Medicine 35, no. 5 (2008): 451-458.
- 42. [305] Sussman, F. G., M. L. Cropper, H. Galbraith, D. Godschalk, J. Loomis, G. Luber, M. A. McGeehin, J. E. Neumann, W. D. Shaw, A. Vedlitz et al. "Effects of Global Change on Human Welfare." In Analyses of the Effects of Global Change on Human Health and Welfare and Human Systems, edited by J. L. Gamble, 111-168. Vol. Synthesis and Assessment Product 4.6. Washington, D.C.: U.S. Environmental Protection Agency, 2008.
- 43. [306] The Potential Effects of Global Climate Change on the United States, Edited by J. B. Smith and D. Tirpak. U.S. Environmental Protection Agency, 1989.
- 44. [303] for and Prevention, Centers Disease Control. West Nile Virus: Statistics, Surveillance, and Control., 2009.
- 45. [304] Kilpatrick, A. M., M. A. Meola, R. M. Moudy, and L. D. Kramer. "Temperature, Viral Genetics, and the Transmission of West Nile Virus by Culex Pipiens Mosquitoes." PLoS Pathogens 4, no. 6 (2008).
- 46. a. b. [307] Ziska, L. H., and F. A. Caulfield. "Rising CO2 and Pollen Production of Common Ragweed (Ambrosia Artemisiifolia L.), A Known Allergy-inducing Species: Implications for Public Health." Australian Journal of Plant Physiology 27, no. 10 (2000): 893-898.
- 47. [308] Mohan, J. E., L. H. Ziska, W. H. Schlesinger, R. B. Thomas, R. C. Sicher, K. George, and J. S. Clark. "Biomass and Toxicity Responses of Poison Ivy (Toxicodendron Radicans) to Elevated Atmospheric CO2." Proceedings of the National Academy of Sciences 103, no. 24 (2006): 9086-9089.
- 48. [309] Hunt, R., D. W. Hand, M. A. Hannah, and A. M. Neal. "Response to CO2 Enrichment in 27 Herbaceous Species." Functional Ecology 5, no. 3 (1991): 410-421.
- 49. [310] Ziska, L. H.. "Evaluation of the Growth Response of Six Invasive Species to Past, Present and Future Atmospheric Carbon Dioxide." Journal of Experimental Botany 54, no. 381 (2003): 395-404.
- 50. a. b. [318] Semenza, J. C., J. E. McCullough, W. D. Flanders, M. A. McGeehin, and J. R. Lumpkin. "Excess Hospital Admissions during the July 1995 Heat Wave in Chicago." American Journal of Preventive Medicine 16, no. 4 (1999): 269-277.
- 51. [311] CDC. National Diabetes Fact Sheet. Atlanta, GA: Centers for Disease Control and Prevention, 2007.
- 52. [312] Patz, J. A., H. K. Gibbs, J. A. Foley, J. V. Rogers, and K. R. Smith. "Climate Change and Global Health: Quantifying a Growing Ethical Crisis." EcoHealth 4, no. 4 (2007): 397-405.
- 53. [164] Field, C., L. D. Mortsch, M. Brklacich, D. L. Forbes, P. Kovacs, J. A. Patz, S. W. Running, and M. J. Scott. "North America." In Climate Change 2007: Impacts Adaptation and Vulnerabiltiy, edited by M. L. Parry, O. F. Canziani, J. P. Palutikof, P. J. van der Linden and C. E. Hanson, 617-652. Vol. Contribution of Working Group II to the Fourth Assessment Report of the Intergovernmental Panel on Climate Change. Cambridge, UK and New York, NY: Cambridge University Press, 2007.