The content of this website is no longer being updated. For information on current assessment activities, please visit http://www.globalchange.gov/what-we-do/assessment
Midwest
Climate on the Move: Changing Summers in the Midwest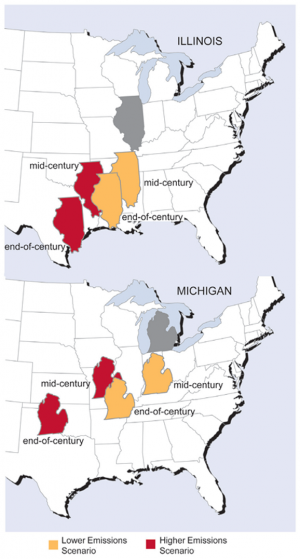 Model projections of summer average temperature and precipitation changes in Illinois and Michigan for mid-century (2040-2059), and end-of-century (2080-2099), indicate that summers in these states are expected to feel progressively more like summers currently experienced in states south and west. Both states are projected to get considerably warmer and have less summer precipitation. Image Reference: Hayhoe et al.1The Midwest’s climate is shaped by the presence of the Great Lakes and the region’s location in the middle of the North American continent. This location, far from the temperature-moderating effects of the oceans, contributes to large seasonal swings in air temperature from hot, humid summers to cold winters. In recent decades, a noticeable increase in average temperatures in the Midwest has been observed, despite the strong year-to-year variations. The largest increase has been measured in winter, extending the length of the frost-free or growing season by more than one week, mainly due to earlier dates for the last spring frost. Heavy downpours are now twice as frequent as they were a century ago. Both summer and winter precipitation have been above average for the last three decades, the wettest period in a century. The Midwest has experienced two record-breaking floods in the past 15 years.2 There has also been a decrease in lake ice, including on the Great Lakes. Since the 1980s, large heat waves have been more frequent in the Midwest than any time in the last century, other than the Dust Bowl years of the 1930s.3,1,4,5,6
Rising Temperatures
During the summer, public health and quality of life, especially in cities, will be negatively affected by increasing heat waves, reduced air quality, and insect and waterborne diseases. In the winter, warming will have mixed impacts.
Number of 1995-like Chicago Heat Waves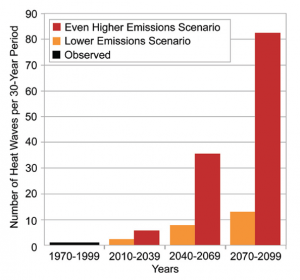 Over the last three decades of this century, heat waves like the one that occurred in Chicago in 1995 are projected to occur about once every three years under the lower emissions scenario.7 Under the even higher emissions scenario, such events are projected to occur an average of nearly three times a year. In this analysis, heat waves were defined as at least one week of daily maximum temperatures greater than 90°F and nighttime minimum temperatures greater than 70°F, with at least two consecutive days with daily temperatures greater than 100°F and nighttime temperatures greater than 80°F. Image Reference: Hayhoe et al.8Heat waves that are more frequent, more severe, and longer lasting are projected. The frequency of hot days and the length of the heat-wave season both will be more than twice as great under the higher emissions scenario91 compared to the lower emissions scenario.7,1,4,5,9 Events such as the Chicago heat wave of 1995, which resulted in over 700 deaths, will become more common. Under the lower emissions scenario,7 such a heat wave is projected to occur every other year in Chicago by the end of the century, while under the higher emissions scenario,7 there would be about three such heat waves per year. Even more severe heat waves, such as the one that claimed tens of thousands of lives in Europe in 2003, are projected to become more frequent in a warmer world, occurring as often as every other year in the Midwest by the end of this century under the higher emissions scenario.7,1,5,10 Some health impacts can be reduced by better preparation for such events.11
During heat waves, high electricity demand combines with climate-related limitations on energy production capabilities (see Energy Supply and Use sector), increasing the likelihood of electricity shortages and resulting in brownouts or even blackouts. This combination can leave people without air conditioning and ventilation when they need it most, as occurred during the 1995 Chicago/Milwaukee heat wave. In general, electricity demand for air conditioning is projected to significantly increase in summer. Improved energy planning could reduce electricity disruptions.
The urban heat island effect can further add to high local daytime and nighttime temperatures (see Human Health sector). Heat waves take a greater toll in illness and death when there is little relief from the heat at night.
Another health-related issue arises from the fact that climate change can affect air quality. A warmer climate generally means more ground-level ozone (a component of smog), which can cause respiratory problems, especially for those who are young, old, or have asthma or allergies. Unless the emissions of pollutants that lead to ozone formation are reduced significantly, there will be more ground-level ozone as a result of the projected climate changes in the Midwest due to increased air temperatures, more stagnant air, and increased emissions from vegetation.1,12,4,5,13,14,15
Insects such as ticks and mosquitoes that carry diseases will survive winters more easily and produce larger populations in a warmer Midwest.1,4,5 One potential risk is an increasing incidence of diseases such as West Nile virus. Waterborne diseases will present an increasing risk to public health because many pathogens thrive in
Adaptation: Chicago Tries to Cool the Urban Heat Island
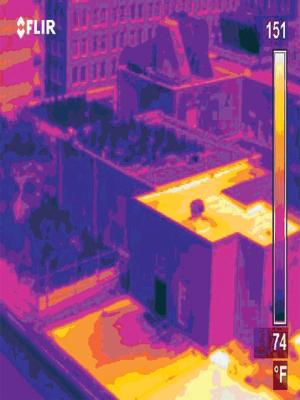 "Green roofs" are coller than the surrounding conventional roofs.Efforts to reduce urban heat island effects become even more important in a warming climate. The City of Chicago has produced a map of urban hotspots to use as a planning tool to target areas that could most benefit from heat-island reduction initiatives such as reflective or green roofing, and tree planting. Created using satellite images of daytime and nighttime temperatures, the map shows the hottest 10 percent of both day and night temperatures in red, and the hottest 10 percent of either day or night in orange.
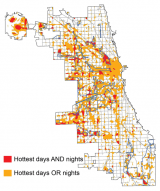 Chicago's urban hot spotsThe City is working to reduce urban heat buildup and the need for air conditioning by using reflective roofing materials. This thermal image shows that the radiating temperature of the City Hall’s “green roof” – covered with soil and vegetation – is up to 77°F cooler than the nearby conventional roofs.16
In winter, oil and gas demand for heating will decline. Warming will also decrease the number of days with snow on the ground, which is expected to improve traffic safety.17 On the other hand, warming will decrease outdoor winter recreational opportunities such as skiing, snowmobiling, ice skating, and ice fishing.
Great Lakes
Significant reductions in Great Lakes water levels, which are projected under higher emissions scenarios, lead to impacts on shipping, infrastructure, beaches, and ecosystems.
Observed Changes in Great Lakes Ice Cover: Seasonal Maximum Coverage, 1973 to 2008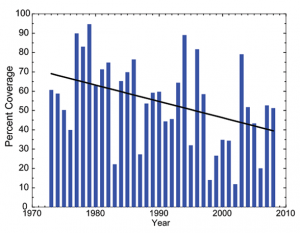 Reductions in winter ice cover lead to more evaporation, causing lake levels to drop even farther. While the graph indicates large year-to-year variations, there is a clear decrease in the extent of Great Lakes ice coverage, as shown by the black trend line. Image Source: updated from Assel18The Great Lakes are a natural resource of tremendous significance, containing 20 percent of the planet’s fresh surface water and serving as the dominant feature of the industrial heartland of the nation. Higher temperatures will mean more evaporation and hence a likely reduction in the Great Lakes water levels. Reduced lake ice increases evaporation in winter, contributing to the decline. Under a lower emissions scenario,7 water levels in the Great Lakes are projected to fall no more than 1 foot by the end of the century, but under a higher emissions scenario,7 they are projected to fall between 1 and 2 feet.1 The greater the temperature rise, the higher the likelihood of a larger decrease in lake levels.19 Even a decrease of 1 foot, combined with normal fluctuations, can result in significant lengthening of the distance to the lakeshore in many places. There are also potential impacts on beaches, coastal ecosystems, dredging requirements, infrastructure, and shipping. For example, lower lake levels reduce “draft,” or the distance between the waterline and the bottom of a ship, which lessens a ship’s ability to carry freight. Large vessels, sized for passage through the St. Lawrence Seaway, lose up to 240 tons of capacity for each inch of draft lost.1,4,5,20 These impacts will have costs, including increased shipping, repair and maintenance costs, and lost recreation and tourism dollars.
Lower Water Levels in the Great Lakes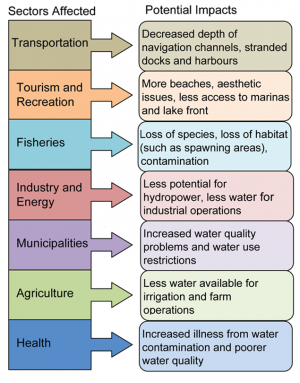 Reduced water levels in the Great Lakes will have interconnected impacts across many sectors, creating mismatches between water supply and demand, and necessitating trade-offs. Regions outside the Midwest will also be affected. For example, a reduction in hydropower potential would affect the Northeast, and reduction in irrigation water would affect regions that depend on agricultural produce from the Midwest. Image Source: adapted from Field et al.21
Projected Changes in Great Lakes Levels under Higher Emissions Scenario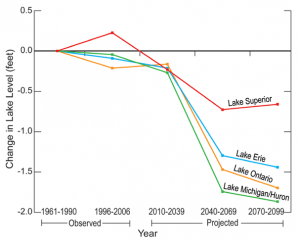 Average Great Lakes levels depend on the balance between precipitation (and corresponding runoff) in the Great Lakes Basin on one hand, and evaporation and outflow on the other. As a result, lower emissions scenarios7 with less warming show less reduction in lake levels than higher emissions scenarios.7 Projected changes in lake levels are based on simulations by the NOAA Great Lakes model for projected climate changes under a higher emissions scenario.7 Image Reference: Hayhoe et al.1
Heavy Precipitation and Drought
The likely increase in precipitation in winter and spring, more heavy downpours, and greater evaporation in summer would lead to more periods of both floods and water deficits.
Precipitation is projected to increase in winter and spring, and to become more intense throughout the year. This pattern is expected to lead to more frequent flooding, increasing infrastructure damage, and impacts on human health. Such heavy downpours can overload drainage systems and water treatment facilities, increasing the risk of waterborne diseases. Such an incident occurred in Milwaukee in 1993 when the water supply was contaminated with the parasite Cryptosporidium, causing 403,000 reported cases of gastrointestinal illness and 54 deaths.22
In Chicago, rainfall of more than 2.5 inches per day is an approximate threshold beyond which combined water and sewer systems overflow into Lake Michigan (such events occurred 2.5 times per decade from 1961 to 1990). This generally results in beach closures to reduce the risk of disease transmission. Rainfall above this threshold is projected to occur twice as often by the end of this century under the lower emissions scenario7 and three times as often under the higher emissions scenario.7,1,5 Similar increases are expected across the Midwest.
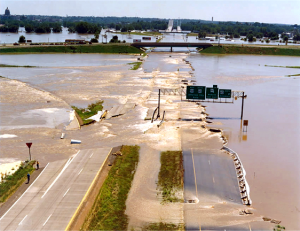 The Great Flood of 1993 caused flooding along 500 miles of the Mississippi and Missouri river systems. The photo shows the flood’s effects on U.S. Highway 54, just north of Jefferson City, Missouri.More intense rainfall can lead to floods that cause significant impacts regionally and even nationally. For example, the Great Flood of 1993 caused catastrophic flooding along 500 miles of the Mississippi and Missouri river systems, affecting one-quarter of all U.S. freight (see Transportation sector).17,23,24,25 Another example was a record-breaking 24-hour rainstorm in July 1996, which resulted in flash flooding in Chicago and its suburbs, causing extensive damage and disruptions, with some commuters not being able to reach Chicago for three days (see Transportation sector).17 There was also a record-breaking storm in August 2007. Increases in such events are likely to cause greater property damage, higher insurance rates, a heavier burden on emergency management, increased clean-up and rebuilding costs, and a growing financial toll on businesses, homeowners, and insurers.
In the summer, with increasing evaporation rates and longer periods between rainfalls, the likelihood of drought will increase and water levels in rivers, streams, and wetlands are likely to decline. Lower water levels also could create problems for river traffic, reminiscent of the stranding of more than 4,000 barges on the Mississippi River during the 1988 drought. Reduced summer water levels are also likely to reduce the recharge of groundwater, cause small streams to dry up (reducing native fish populations), and reduce the area of wetlands in the Midwest.
Crops, Livestock, and Forests
While the longer growing season provides the potential for increased crop yields, increases in heat waves, floods, droughts, insects, and weeds will present increasing challenges to managing crops, livestock, and forests.
Observed and Projected Changes in Plant Hardiness Zones Plant winter hardiness zones in the Midwest have already changed significantly as shown above, and are projected to shift one-half to one full zone every 30 years, affecting crop yields and where plant species can grow. By the end of this century, plants now associated with the Southeast are likely to become established throughout the Midwest. In the graphic, each zone represents a 10°F range in the lowest temperature of the year, with zone 3 representing –40 to –30°F and zone 8 representing 10 to 20°F. Image Source: © 2006 by Arbor Day Foundation®26; Image Reference: CMIP3-B27
The projected increase in winter and spring precipitation and flooding is likely to delay planting and crop establishment. Longer growing seasons and increased carbon dioxide have positive effects on some crop yields, but this is likely to be counterbalanced in part by the negative effects of additional disease-causing pathogens, insect pests, and weeds (including invasive weeds).28 Livestock production is expected to become more costly as higher temperatures stress livestock, decreasing productivity and increasing costs associated with the needed ventilation and cooling equipment.28
Plant winter hardiness zones (each zone represents a 10°F change in minimum temperature) in the Midwest are likely to shift one-half to one full zone about every 30 years. By the end of the century, plants now associated with the Southeast are likely to become established throughout the Midwest.
Impacts on forests are likely to be mixed, with the positive effects of higher carbon dioxide and nitrogen levels acting as fertilizers potentially negated by the negative effects of decreasing air quality.29 In addition, more frequent droughts, and hence fire hazards, and an increase in destructive insect pests, such as gypsy moths, hinder plant growth. Insects, historically controlled by cold winters, more easily survive milder winters and produce larger populations in a warmer climate (see Agriculture and Ecosystems sectors).
Ecosystems
Native species are very likely to face increasing threats from rapidly changing climate conditions, pests, diseases, and invasive species moving in from warmer regions.
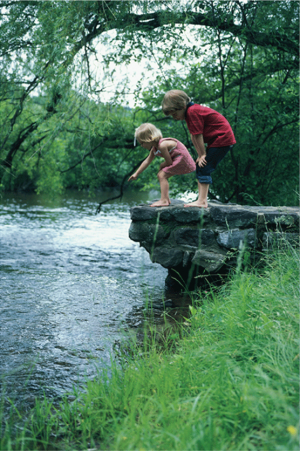 As air temperatures increase, so will water temperatures. In some lakes, this will lead to an earlier and longer period in summer during which mixing of the relatively warm surface lake water with the colder water below is reduced.30 In such cases, this stratification can cut off oxygen from bottom layers, increasing the risk of oxygen-poor or oxygen-free “dead zones” that kill fish and other living things. In lakes with contaminated sediment, warmer water and low-oxygen conditions can more readily mobilize mercury and other persistent pollutants.31 In such cases, where these increasing quantities of contaminants are taken up in the aquatic food chain, there will be additional potential for health hazards for species that eat fish from the lakes, including people.32
Populations of coldwater fish, such as brook trout, lake trout, and whitefish, are expected to decline dramatically, while populations of coolwater fish such as muskie, and warmwater species such as smallmouth bass and bluegill, will take their place. Aquatic ecosystem disruptions are likely to be compounded by invasions by non-native species, which tend to thrive under a wide range of environmental conditions. Native species, adapted to a narrower range of conditions, are expected to decline.
All major groups of animals, including birds, mammals, amphibians, reptiles, and insects, will be affected by impacts on local populations, and by competition from other species moving into the Midwest region.33 The potential for animals to shift their ranges to keep pace with the changing climate will be inhibited by major urban areas and the presence of the Great Lakes.
References
- 1. a. b. c. d. e. f. g. h. i. j. [283] Hayhoe, K., J. VanDorn, T. Croley III, N. Schlegal, and D. Wuebbles. "Regional Climate Change Projections for Chicago and the U.S. Great Lakes." Journal of Great Lakes Research 36, no. Supplement 2 (2010): 7-21.
- 2. [213] Center, NOAA's National Climatic Data. Midwestern U.S. Flood Overview., 2008.
- 3. [112] Kunkel, K., P. D. Bromirski, H. E. Brooks, T. Cavazos, A. V. Douglas, D. R. Easterling, K. Emanuel, P.Ya. Groisman, G. J. Holland, T. R. Knutson et al. "Observed Changes in Weather and Climate Extremes." In Weather and Climate Extremes in a Changing Climate: Regions of Focus: North America, Hawaii, Caribbean, and U.S. Pacific Islands, edited by T. R. Karl, G. A. Meehl, C. D. Miller, S. J. Hassol, A. M. Waple and W. L. Murray, 35-80. Vol. CCSP Synthesis and Assessment Product 3.3. Washington, D.C.: U.S. Climate Change Science Program, 2008.
- 4. a. b. c. d. e. [402] Kling, G. W., K. Hayhoe, L. B. Johnson, J. J. Magnuson, S. Polasky, S. K. Robinson, B. J. Shuter, M. M. Wander, D. Wuebbles, and D. R. Zak. Confronting Climate Change in the Great Lakes Region: Impacts on Our Communities and Ecosystems. Washington, D.C.: Ecological Society of America, 2003.
- 5. a. b. c. d. e. f. g. [403] Hayhoe, K., D. Wuebbles, and Climate Science Team. Climate Change and Chicago: Projections and Potential Impacts. Chicago, IL: City of Chicago, 2008.
- 6. [404] Wuebbles, D. J., and K. Hayhoe. "Climate Change Projections for the United States Midwest." Mitigation and Adaptation Strategies for Global Change 9, no. 4 (2004): 335-363.
- 7. a. b. c. d. e. f. g. h. i. j. k. l. [91] various. footnote 91., 2009.
- 8. [407] Hayhoe, K., S. Sheridan, L. Kalkstein, and J. S. Greene. "Climate Change, Heat Waves, and Mortality Projections for Chicago." Journal of Great Lakes Research 36, no. Supplement 2 (2010): 65-73.
- 9. [405] Ebi, K. L., and G. A. Meehl. "The Heat is On: Climate Change and Heat Waves in the Midwest." In Regional Impacts of Climate Change: Four Case Studies in the United States, 8-21. Arlington, VA: Pew Center on Global Climate Change, 2007.
- 10. [406] Kalkstein, L. S., J. S. Greene, D. M. Mills, A. D. Perrin, J. P. Samenow, and J. - C. Cohen. "Analog European Heat Waves for U.S. Cities to Analyze Impacts on Heat-related Mortality." Bulletin of the American Meteorological Society 89, no. 1 (2008): 75-85.
- 11. [288] Ebi, K. L., T. J. Teisberg, L. S. Kalkstein, L. Robinson, and R. F. Weiher. "Heat Watch/Warning Systems Save Lives - Estimated Costs and Benefits for Philadelphia 1995-98." Bulletin of the American Meteorological Society 85, no. 8 (2004): 1067-1073.
- 12. [291] Tao, Z., A. Williams, H. - C. Huang, M. Caughey, and X. - Z. Liang. "Sensitivity of U.S. Surface Ozone to Future Emissions and Climate Changes." Geophysical Research Letters 34 (2007): L08811.
- 13. [408] Lin, J. - T., K. O. Patten, X. - Z. Liang, and D. J. Wuebbles. "Climate Change Effects on Ozone Air Quality in the United States and China with Constant Precursor Emissions." Journal of Applied Meteorology and Climatology 47, no. 7 (2008): 1888-1909.
- 14. [409] Holloway, T., S. N. Spak, D. Barker, M. Bretl, C. Moberg, K. Hayhoe, J. VanDorn, and D. Wuebbles. "Change in Ozone Air Pollution over Chicago Associated with Global Climate Change." Journal of Geophysical Research-Atmospheres 113 (2008).
- 15. [410] Hedegaard, G. B., J. Brandt, J. H. Christensen, L. M. Frohn, C. Geels, K. M. Hansen, and M. Stendel. "Impacts of Climate Change on Air Pollution Levels in the Northern Hemisphere with Special Focus on Europe and the Arctic." Atmospheric Chemistry and Physics 8, no. 12 (2008): 3337-3367.
- 16. [411] various. footnote 411., 2009.
- 17. a. b. c. [222] Council, National Research. Potential Impacts of Climate Change on U.S. Transportation. Vol. Special Report 290. Washington, D.C.: Transportation Research Board, 2008.
- 18. [414] Assel, R. A.. An Electronic Atlas of Great Lakes Ice Cover, Winters: 1973-2002. Ann Arbor, MI: NOAA Great Lakes Environmental Research Laboratory, 2003.
- 19. [412] Angel, J. R., and K. E. Kunkel. "The Response of Great Lakes Water Levels to Future Climate Scenarios with an Emphasis on Lake Michigan-Huron." Journal of Great Lakes Research 36, no. Supplement 2 (2010): 51-58.
- 20. [413] Annin, P.. The Great Lakes Water Wars. Washington, D.C.: Island Press, 2006.
- 21. [164] Field, C., L. D. Mortsch, M. Brklacich, D. L. Forbes, P. Kovacs, J. A. Patz, S. W. Running, and M. J. Scott. "North America." In Climate Change 2007: Impacts Adaptation and Vulnerabiltiy, edited by M. L. Parry, O. F. Canziani, J. P. Palutikof, P. J. van der Linden and C. E. Hanson, 617-652. Vol. Contribution of Working Group II to the Fourth Assessment Report of the Intergovernmental Panel on Climate Change. Cambridge, UK and New York, NY: Cambridge University Press, 2007.
- 22. [219] Team, National Assessment Synthesis. Climate Change impacts on the United States: The Potential Consequences of Climate Variability and Change. Cambridge, UK and New York, NY, 2001.
- 23. [415] The Great Flood of 1993: Causes, Impacts, and Responses, Edited by S. A. Changnon. Boulder, CO: Westview Press, 1996.
- 24. [416] Changnon, S. A., and K. E. Kunkel. Severe Storms in the Midwest. Champaign, IL: Illinois State Water Survey, 2006.
- 25. [417] Kunkel, K. E., K. Andsager, G. Conner, W. L. Decker, H. J. Hillaker, P. N. Knox, F. V. Nurnberger, J. C. Rogers, K. Scheeringa, W. M. Wendland et al. "An Expanded Digital Daily Database for Climatic Resources Applications in the Midwestern United States." Bulletin of the American Meteorological Society 79, no. 7 (1998): 1357-1366.
- 26. [418] various. footnote 418., 2009.
- 27. [117] various. footnote 117., 2009.
- 28. a. b. [193] Hatfield, J., K. Boote, P. Fay, L. Hahn, C. Izaurralde, B. A. Kimball, T. Mader, J. Morgan, D. Ort, W. Polley et al. "Agriculture." In The Effects of Climate Change on Agriculture, Land Resources, and Biodiversity in the United States, edited by P. Backlund, A. Janetos, D. Schimel, J. Hatfield, K. Boote, P. Fay, L. Hahn, C. Izaurralde, B. A. Kimball, T. Mader et al., 21-74. Vol. Synthesis and Assessment Product 4.3. Washington, D.C.: U.S. Department of Agriculture, 2008.
- 29. [243] Ryan, M. G., S. R. Archer, R. Birdsey, C. Dahm, L. Heath, J. Hicke, D. Hollinger, T. Huxman, G. Okin, R. Oren et al. "Land Resources." In The Effects of Climate Change on Agriculture, Land Resources, Water Resources, and Biodiversity in the United States, edited by P. Backlund, A. Janetos, D. Schimel, J. Hatfield, K. Boote, P. Fay, L. Hahn, C. Izaurralde, B. A. Kimball, T. Mader et al., 75-120. Vol. Synthesis and Assessment Product 3.3. Washington, D.C.: U.S. Department of Agriculture, 2008.
- 30. [564] Hondzo, M., and H. G. Stefan. "Three Case Studies of Lake Temperature and Stratification Response to Warmer Climate." Water Resources Research 27, no. 8 (1991): 1837-1846.
- 31. [565] Morel, F. M. M., A. M. L. Kraepiel, and M. Amyot. "The Chemical Cycle and Bioaccumulation of Mercury." Annual Review of Ecology and Systematics 29 (1998): 543-566.
- 32. [566] Williamson, C. E., J. E. Saros, and D. W. Schindler. "Sentinels of Change." Science 323, no. 5916 (2009): 887-888.
- 33. [70] Janetos, A., L. Hansen, D. Inouye, B. P. Kelly, L. Meyerson, B. Peterson, and R. Shaw. "Biodiversity." In The Effects of Climate Change on Agriculture, Land Resources, Water Resources, and Biodiversity in the United States, edited by P. Backlund, A. Janetos, D. Schimel, J. Hatfield, K. Boote, P. Fay, L. Hahn, C. Izaurralde, B. A. Kimball, T. Mader et al., 151-181. Vol. Synthesis and Assessment Product 4.3. Washington, D.C.: U.S. Department of Agriculture, 2008.