The content of this website is no longer being updated. For information on current assessment activities, please visit http://www.globalchange.gov/what-we-do/assessment
Water Resources
Key Messages:
- Climate change has already altered, and will continue to alter, the water cycle, affecting where, when, and how much water is available for all uses.
- Floods and droughts are likelyat least two-thirds chance of occurring to become more common and more intense as regional and seasonal precipitation patterns change, and rainfall becomes more concentrated into heavy events (with longer, hotter dry periods in between).
- Precipitation and runoff are likelyat least two-thirds chance of occurring to increase in the Northeast and Midwest in winter and spring, and decrease in the West, especially the Southwest, in spring and summer.
- In areas where snowpack dominates, the timing of runoff will continue to shift to earlier in the spring and flows will be lower in late summer.
- Surface water quality and groundwater quantity will be affected by a changing climate.
- Climate change will place additional burdens on already stressed water systems.
- The past century is no longer a reasonable guide to the future for water management.
Changes in the water cycle, which are consistent with the warming observed over the past several decades, include:
- Changes in precipitation patterns and intensity
- Changes in the incidence of drought
- Widespread melting of snow and ice
- Increasing atmospheric water vapor
- Increasing evaporation
- Increasing water temperatures
- Reductions in lake and river ice
- Changes in soil moisture and runoff
For the future, marked regional differences are projected, with increases in annual precipitation, runoff, and soil moisture in much of the Midwest and Northeast, and declines in much of the West, especially the Southwest.
The impacts of climate change include too little water in some places, too much water in other places, and degraded water quality. Some locations are expected to be subject to all of these conditions during different times of the year. Water cycle changes are expected to continue and to adversely affect energy production and use, human health, transportation, agriculture, and ecosystems (see Highlights of Water-Related Impacts by Sector table below).1
Water Cycle Changes
Climate change has already altered, and will continue to alter, the water cycle, affecting where, when, and how much water is available for all uses.
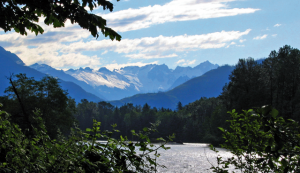 Skagit River and surrounding mountains in the Northwest
Substantial changes to the water cycle are expected as the planet warms because the movement of water in the atmosphere and oceans is one of the primary mechanisms for the redistribution of heat around the world. Evidence is mounting that human-induced climate change is already altering many of the existing patterns of precipitation in the United States, including when, where, how much, and what kind of precipitation falls.2,1 A warmer climate increases evaporation of water from land and sea, and allows more moisture to be held in the atmosphere. For every 1°F rise in temperature, the water holding capacity of the atmosphere increases by about 4 percent.3
In addition, changes in atmospheric circulation will tend to move storm tracks northward with the result that dry areas will become drier and wet areas wetter. Hence, the arid Southwest is projected to experience longer and more severe droughts from the combination of increased evaporation and reductions in precipitation.4
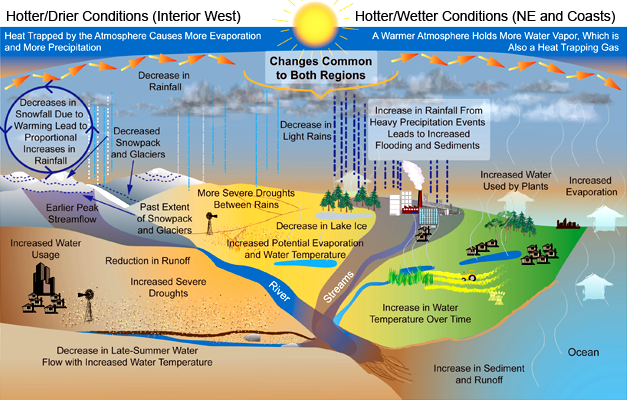 Projected Changes in the Water Cycle: The water cycle exhibits many changes as the Earth warms. Wet and dry areas respond differently.
Changes in Snowfall Contribution to Wintertime Precipitation 1949 to 2005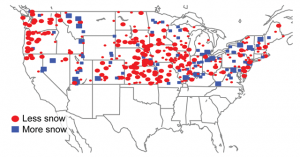 Trends in winter snow-to-total precipitation ratio from 1949 to 2005. Red circles indicate less snow, while blue squares indicate more snow. Large circles and squares indicate the most significant trends5. Areas south of 37ºN latitude were excluded from the analysis because most of that area receives little snowfall. White areas above that line have inadequate data for this analysis. Image Reference: Feng and Hu5The additional atmospheric moisture contributes to more overall precipitation in some areas, especially in much of the Northeast, Midwest, and Alaska. Over the past 50 years, precipitation and streamflow have increased in much of the Northeast and Midwest, with a reduction in drought duration and severity. Much of the Southeast and West has had reductions in precipitation and increases in drought severity and duration, especially in the Southwest.
In most areas of the country, the fraction of precipitation falling as rain versus snow has increased during the last 50 years. Despite this general shift from snow to rain, snowfalls along the downwind coasts of the Great Lakes have increased. Factors contributing to this increase include reduced ice cover due to warming, which lengthens the period of open water. In addition, cold air moving over relatively warm, open lake water induces strong evaporation, often causing heavy lake-effect snow. Heavy snowfall and snowstorm frequency have increased in many northern parts of the United States. In the South however, where temperatures are already marginal for heavy snowfall, climate warming has led to a reduction in heavy snowfall and snowstorm frequency. These trends suggest a northward shift in snowstorm occurrence.2
| Observed Water-Related Changes During the Last Century1 | ||
| Observed Change | Direction of Change | Region Affected |
|---|---|---|
| One to four week earlier peak streamflow due to earlier warming-driven snowmelt | Earlier | West and Northeast |
| Proportion of precipitation falling as snow | Decreasing | West and Northeast |
| Duration and extent of snow cover | Decreasing | Most of the United States |
| Mountain snow water equivalent | Decreasing | West |
| Annual precipitation | Increasing | Most of the United States |
| Annual precipitation | Decreasing | Southwest |
| Frequency of heavy precipitation events | Increasing | Most of the United States |
| Runoff and streamflow | Decreasing | Colorado and Columbia River Basins |
| Streamflow | Increasing | Most of East |
| Amount of ice in mountain glaciers | Decreasing | U.S. western mountains, Alaska |
| Water temperature of lakes and streams | Increasing | Most of the United States |
| Ice cover on lakes and rivers | Decreasing | Great Lakes and Northeast |
| Periods of drought | Increasing | Parts of West and East |
| Salinization of surface waters | Increasing | Florida, Louisiana |
| Widespread thawing of permafrost | Increasing | Alaska |
Observed Drought Trends 1958 to 2007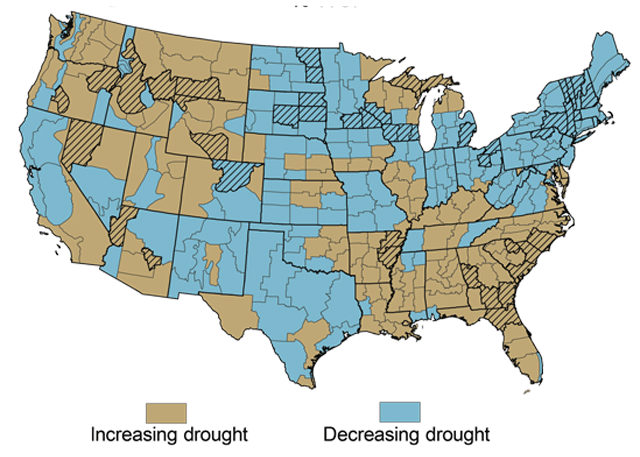 Trends in end-of-summer drought as measured by the Palmer Drought Severity Index from 1958 to 2007 in each of 344 U.S. climate divisions.6 Hatching indicates significant trends. Image Reference: Guttman and Quayle6
Flooding and Drought
Floods and droughts are likelyat least two-thirds chance of occurring to become more common and more intense as regional and seasonal precipitation patterns change, and rainfall becomes more concentrated into heavy events (with longer, hotter dry periods in between).
Increases in the Number of Days with Very Heavy Precipitation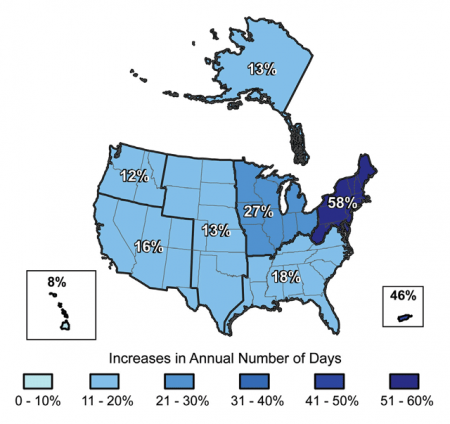 The map shows the percentage increases in the average number of days with very heavy precipitation (defined as the heaviest 1 percent of all events) from 1958 to 2007 for each region. There are clear trends toward more days with very heavy precipitation for the nation as a whole, and particularly in the Northeast and Midwest. Image Source: updated from Groisman et al.7While it sounds counterintuitive, a warmer world produces both wetter and drier conditions. Even though total global precipitation increases, the regional and seasonal distribution of precipitation changes, and more precipitation comes in heavier rains (which can cause flooding) rather than light events. In the past century, averaged over the United States, total precipitation has increased by about 7 percent, while the heaviest 1 percent of rain events increased by nearly 20 percent.2 This has been especially noteworthy in the Northeast, where the annual number of days with very heavy precipitation has increased most in the past 50 years, as shown in the adjacent figure. Flooding often occurs when heavy precipitation persists for weeks to months in large river basins. Such extended periods of heavy precipitation have also been increasing over the past century, most notably in the past two to three decades in the United States.8
Observations also show that over the past several decades, extended dry periods have become more frequent in parts of the United States, especially the Southwest and the eastern United States.9,10 Longer periods between rainfalls, combined with higher air temperatures, dry out soils and vegetation, causing drought.
For the future, precipitation intensity is projected to increase everywhere, with the largest increases occurring in areas in which average precipitation increases the most. For example, the Midwest and Northeast, where total precipitation is expected to increase the most, would also experience the largest increases in heavy precipitation events. The number of dry days between precipitation events is also projected to increase, especially in the more arid areas. Mid-continental areas and the Southwest are particularly threatened by future drought. The magnitude of the projected changes in extremes is expected to be greater than changes in averages, and hence detectable sooner.3,2,11,1,12
Runoff
Precipitation and runoff are likelyat least two-thirds chance of occurring to increase in the Northeast and Midwest in winter and spring, and decrease in the West, especially the Southwest, in spring and summer.
Projected Changes in Annual Runoff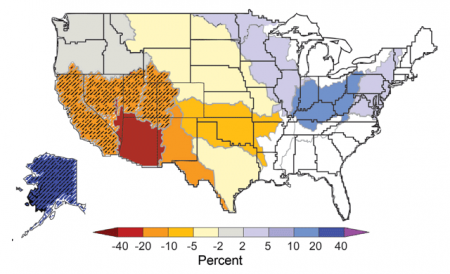 Projected changes in median runoff for 2041-2060, relative to a 1901-1970 baseline, are mapped by water-resource region. Colors indicate percentage changes in runoff. Hatched areas indicate greater confidence due to strong agreement among model projections. White areas indicate divergence among model projections. Results are based on emissions in between the lower and higher emissions scenarios.13 Image Reference: Milly et al.14Runoff, which accumulates as streamflow, is the amount of precipitation that is not evaporated, stored as snowpack or soil moisture, or filtered down to groundwater. The proportion of precipitation that runs off is determined by a variety of factors including temperature, wind speed, humidity, solar intensity at the ground, vegetation, and soil moisture. While runoff generally tracks precipitation, increases and decreases in precipitation do not necessarily lead to equal increases and decreases in runoff. For example, droughts cause soil moisture reductions that can reduce expected runoff until soil moisture is replenished. Conversely, water-saturated soils can generate floods with only moderate additional precipitation. During the last century, consistent increases in precipitation have been found in the Midwest and Northeast along with increased runoff.15,16 Climate models consistently project that the East will experience increased runoff, while there will be substantial declines in the interior West, especially the Southwest. Projections for runoff in California and other parts of the West also show reductions, although less than in the interior West. In short, wet areas are projected to get wetter and dry areas drier. Climate models also consistently project heat-related summer soil moisture reductions in the middle of the continent.17,1,9,15
Snowpack
In areas where snowpack dominates, the timing of runoff will continue to shift to earlier in the spring and flows will be lower in late summer.
Simulated Changes in Annual Runoff Pattern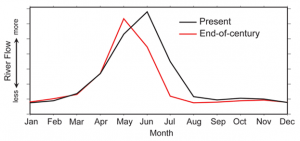 General schematic of changes in the annual pattern of runoff for snowmelt-dominated streams. Compared to the historical pattern, runoff peak is projected to shift to earlier in the spring and late summer flows are expected to be lower. The above example is for the Green River, which is part of the Colorado River watershed. Image Reference: Christensen et al.18
Trends in Peak Streamflow Timing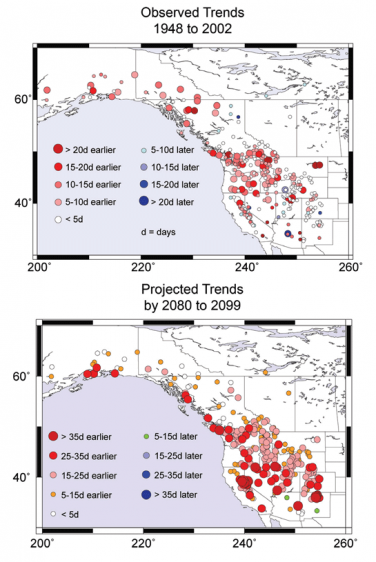 Top map shows changes in runoff timing in snowmelt-driven streams from 1948 to 2002 with red circles indicating earlier runoff, and blue circles indicating later runoff. Bottom map shows projected changes in snowmelt-driven streams by 2080-2099, compared to 1951-1980, under a higher emissions scenario.13 Image Reference: Stewart et al.19Large portions of the West and some areas in the Northeast rely on snowpack as a natural reservoir to hold winter precipitation until it later runs off as streamflow in spring, summer, and fall. Over the last 50 years, there have been widespread temperature-related reductions in snowpack in the West, with the largest reductions occurring in lower elevation mountains in the Northwest and California where snowfall occurs at temperatures close to the freezing point.1,20 The Northeast has also experienced snowpack reductions during a similar period. Observations indicate a transition to more rain and less snow in both the West and Northeast in the last 50 years.5,21,22,23 Runoff in snowmelt-dominated areas is occurring up to 20 days earlier in the West, and up to 14 days earlier in the Northeast.19,24 Future projections for most snowmelt-dominated basins in the West consistently indicate earlier spring runoff, in some cases up to 60 days earlier.19,25 For the Northeast, projections indicate spring runoff will advance by up to 14 days.16 Earlier runoff produces lower late-summer streamflows, which stress human and environmental systems through less water availability and higher water temperatures.7 Scientific analyses to determine the causes of recent changes in snowpack, runoff timing, and increased winter temperatures have attributed these changes to human-caused climate change.26,27,28
Water Quality and Quantity
Surface water quality and groundwater quantity will be affected by a changing climate.
Lake Superior Summer Air and Water Temperatures 1979 to 2006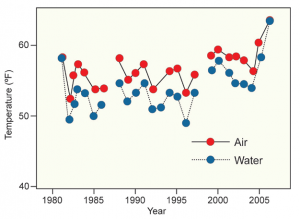 The recent large jump in summer water temperature is related to the recent large reduction in ice cover (see Midwest region). Image Reference: Austin and Colman29
Changes in water quality
Increased air temperatures lead to higher water temperatures, which have already been detected in many streams, especially during low-flow periods. In lakes and reservoirs, higher water temperatures lead to longer periods of summer stratification (when surface and bottom waters do not mix). Dissolved oxygen is reduced in lakes, reservoirs, and rivers at higher temperatures. Oxygen is an essential resource for many living things, and its availability is reduced at higher temperatures both because the amount that can be dissolved in water is lower and because respiration rates of living things are higher. Low oxygen stresses aquatic animals such as coldwater fish and the insects and crustaceans on which they feed.1 Lower oxygen levels also decrease the self-purification capabilities of rivers.
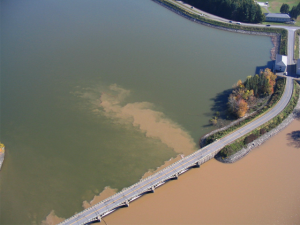 Heavy rain can cause sediments to become suspended in water, reducing its quality, as seen in the brown swath above in New York City’s Ashokan reservoir following Hurricane Floyd in September 1999.
The negative effects of water pollution, including sediments, nitrogen from agriculture, disease pathogens, pesticides, herbicides, salt, and thermal pollution, will be amplified by observed and projected increases in precipitation intensity and longer periods when streamflows are low.9 The U.S. Environmental Protection Agency expects the number of waterways considered “impaired” by water pollution to increase.30 Heavy downpours lead to increased sediment in runoff and outbreaks of waterborne diseases.31,32 Increases in pollution carried to lakes, estuaries, and the coastal ocean, especially when coupled with increased temperature, can result in blooms of harmful algae and bacteria. However, pollution has the potential of being diluted in regions that experience increased streamflow.
Water-quality changes during the last century were probably due to causes other than climate change, primarily changes in pollutants.15
Changes in groundwater
Many parts of the United States are heavily dependent on groundwater for drinking, residential, and agricultural water supplies.32 How climate change will affect groundwater is not well known, but increased water demands by society in regions that already rely on groundwater will clearly stress this resource, which is often drawn down faster than it can be recharged.32 In many locations, groundwater is closely connected to surface water and thus trends in surface water supplies over time affect groundwater. Changes in the water cycle that reduce precipitation or increase evaporation and runoff would reduce the amount of water available for recharge. Changes in vegetation and soils that occur as temperature changes or due to fire or pest outbreaks are also likelyat least two-thirds chance of occurring to affect recharge by altering evaporation and infiltration rates. More frequent and larger floods are likelyat least two-thirds chance of occurring to increase groundwater recharge in semi-arid and arid areas, where most recharge occurs through dry streambeds after heavy rainfalls and floods.1
Sea-level rise is expected to increase saltwater intrusion into coastal freshwater aquifers, making some unusable without desalination.9 Increased evaporation or reduced recharge into coastal aquifers exacerbates saltwater intrusion. Shallow groundwater aquifers that exchange water with streams are likely to be the most sensitive part of the groundwater system to climate change. Small reductions in groundwater levels can lead to large reductions in streamflow and increases in groundwater levels can increase streamflow.33 Further, the interface between streams and groundwater is an important site for pollution removal by microorganisms. Their activity will change in response to increased temperature and increased or decreased streamflow as climate changes, and this will affect water quality. Like water quality, research on the impacts of climate change on groundwater has been minimal.15
Climate Stress on Water Systems
Climate change will place additional burdens on already stressed water systems.
In many places, the nation’s water systems are already taxed due to aging infrastructure, population increases, and competition among water needs for farming, municipalities, hydropower, recreation, and ecosystems.34,35,36 Climate change will add another factor to existing water management challenges, thus increasing vulnerability.37 The U.S. Bureau of Reclamation has identified many areas in the West that are already at risk for serious conflict over water, even in the absence of climate change38 (see figure below).
Adapting to gradual changes, such as changes in average amounts of precipitation, is less difficult than adapting to changes in extremes. Where extreme events, such as droughts or floods, become more intense or more frequent with climate change, the economic and social costs of these events will increase.39 Water systems have life spans of many years and are designed with spare capacity. These systems are thus able to cope with small changes in average conditions.39 Water resource planning today considers a broad range of stresses and hence adaptation to climate change will be one factor among many in deciding what actions will be taken to minimize vulnerability.39,40,41
Rapid regional population growth
The U.S. population is estimated to have grown to more than 300 million people, nearly a 7 percent increase since the 2000 Census. Current Census Bureau projections are for this growth rate to continue, with the national population projected to reach 350 million by 2025 and 420 million by 2050. The highest rates of population growth to 2025 are projected to occur in areas such as the Southwest that are at risk for reductions in water supplies due to climate change.34
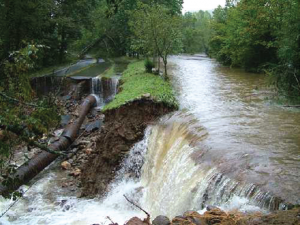 Damage to the city water system in Asheville, North Carolina, due to heavy rain in 2004.Aging water infrastructure
The nation’s drinking water and wastewater infrastructure is aging. In older cities, some buried water mains are over 100 years old and breaks of these lines are a significant problem. Sewer overflows resulting in the discharge of untreated wastewater also occur frequently. Heavier downpours will exacerbate existing problems in many cities, especially where stormwater catchments and sewers are combined. Drinking water and sewer infrastructure is very expensive to install and maintain. Climate change will present a new set of challenges for designing upgrades to the nation’s water delivery and sewage removal infrastructure.35
Potential Water Supply Conflicts by 2025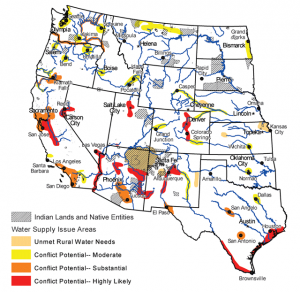 The map shows regions in the West where water supply conflicts are likely to occur by 2025 based on a combination of factors including population trends and potential endangered species’ needs for water. The red zones are where the conflicts are most likely to occur. This analysis does not factor in the effects of climate change, which is expected to exacerbate many of these already-identified issues.38 Image Reference: USBR38
Existing water disputes across the country
Many locations in the United States are already undergoing water stress. The Great Lakes states are establishing an interstate compact to protect against reductions in lake levels and potential water exports. Georgia, Alabama, and Florida are in a dispute over water for drinking, recreation, farming, environmental purposes, and hydropower in the Apalachicola–Chattahoochee–Flint River system.42,43
The State Water Project in California is facing a variety of problems in the Sacramento Delta, including endangered species, saltwater intrusion, and potential loss of islands due to flood- or earthquake-caused levee failures.44,45,46,47,48,49 A dispute over endangered fish in the Rio Grande has been ongoing for many years.50 The Klamath River in Oregon and California has been the location of a multi-year disagreement over native fish, hydropower, and farming.51,52 The Colorado River has been the site of numerous interstate quarrels over the last century.53,54 Large, unquantified Native American water rights challenge existing uses in the West (see Southwest region).55 By changing the existing patterns of precipitation and runoff, climate change will add another stress to existing problems.
Changing water demands
Water demands are expected to change with increased temperatures. Evaporation is projected to increase over most of the United States as temperatures rise. Higher temperatures and longer dry periods are expected to lead to increased water demand for irrigation. This may be partially offset by more efficient use of water by plants due to rising atmospheric carbon dioxide. Higher temperatures are projected to increase cooling water withdrawals by electrical generating stations. In addition, greater cooling requirements in summer will increase electricity use, which in turn will require more cooling water for power plants. Industrial and municipal demands are expected to increase slightly.9
Future of Water Management
The past century is no longer a reasonable guide to the future for water management.
Long-Term Aridity Changes in the West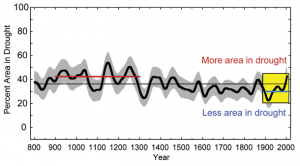 The black line shows the percentage of the area affected by drought (Palmer Drought Severity Index less than –1) in the West over the past 1,200 years. The red line indicates the average drought area in the years 900 to 1300. The blue horizontal line in the yellow box indicates the average during the period from 1900 to 2000, illustrating that the most recent period, during which population and water infrastructure grew rapidly in the West, was wetter than the long-term average (thin horizontal black line).56 Droughts shown in the period 1100-1300 significantly exceed those that have occurred over the past 100 years. Image Reference: Cook et al.56
Water planning and management have been based on historical fluctuations in records of stream flows, lake levels, precipitation, temperature, and water demands. All aspects of water management including reservoir sizing, reservoir flood operations, maximum urban stormwater runoff amounts, and projected water demands have been based on these records. Water managers have proven adept at balancing supplies and demand through the significant climate variability of the past century.1 Because climate change will significantly modify many aspects of the water cycle, the assumption of an unchanging climate is no longer appropriate for many aspects of water planning. Past assumptions derived from the historical record about supply and demand will need to be revisited for existing and proposed water projects.1,14,41
Drought studies that consider the past 1,200 years indicate that in the West, the last century was significantly wetter than most other centuries. Multi-decade “megadroughts” in the years 900 to 1300 were substantially worse than the worst droughts of the last century, including the Dust Bowl era. The causes of these events are only partially known; if they were to reoccur, they would clearly stress water management, even in the absence of climate change (see figure above).57,15,56
| Highlights of Water-Related Impacts by Sector | |
| Sector | Examples of Impacts |
|---|---|
| Human Health | Heavy downpours increase incidence of waterborne disease and floods, resulting in potential hazards to human life and health.31 |
| Energy Supply and Use | Hydropower production is reduced due to low flows in some regions. Power generation is reduced in fossil fuel and nuclear plants due to increased water temperatures and reduced cooling water availability.58 |
| Transportation | Floods and droughts disrupt transportation. Heavy downpours affect harbor infrastructure and inland waterways. Declining Great Lakes levels reduce freight capacity.59 |
| Agriculture and Forests | Intense precipitation can delay spring planting and damage crops. Earlier spring snowmelt leads to increased number of forest fires.60 |
| Ecosystems | Coldwater fish threatened by rising water temperatures. Some warmwater fish will expand ranges.61 |
The intersection of substantial changes in the water cycle with multiple stresses such as population growth and competition for water supplies means that water planning will be doubly challenging. The ability to modify operational rules and water allocations is likely to be critical for the protection of infrastructure, for public safety, to ensure reliability of water delivery, and to protect the environment. There are, however, many institutional and legal barriers to such changes in both the short and long term.62 Four examples:
- The allocation of the water in many interstate rivers is governed by compacts, international treaties, federal laws, court decrees, and other agreements that are difficult to modify.
- Reservoir operations are governed by “rule curves” that require a certain amount of space to be saved in a reservoir at certain times of year to capture a potential flood. Developed by the U.S. Army Corps of Engineers based on historical flood data, many of these rule curves have never been modified, and modifications might require Environmental Impact Statements.14
- In most parts of the West, water is allocated based on a “first in time means first in right” system, and because agriculture was developed before cities were established, large volumes of water typically are allocated to agriculture. Transferring agricultural rights to municipalities, even for short periods during drought, can involve substantial expense and time and can be socially divisive.
- Conserving water does not necessarily lead to a right to that saved water, thus creating a disincentive for conservation.
Total U.S. water diversions peaked in the 1980s, which implies that expanding supplies in many areas to meet new needs are unlikely to be a viable option, especially in arid areas likely to experience less precipitation. However, over the last 30 years, per capita water use has decreased significantly (due, for example, to more efficient technologies such as drip irrigation) and it is anticipated that per capita use will continue to decrease, thus easing stress.15
Adaptation: New York City Begins Planning for Climate Change
The New York City Department of Environmental Protection (DEP), the agency in charge of providing the city’s drinking water and wastewater treatment, is beginning to alter its planning to take into account the effects of climate change – sea-level rise, higher temperatures, increases in extreme events, and changing precipitation patterns – on the city’s water systems. In partnership with Columbia University, DEP is evaluating climate change projections, impacts, indicators, and adaptation and mitigation strategies.
City planners have begun to address these issues by defining risks using probabilistic climate scenarios and considering potential adaptations that relate to operations/management, infrastructure, and policy. For example, DEP is examining the feasibility of relocating critical control systems to higher floors in low-lying buildings or to higher ground, building flood walls, and modifying design criteria to reflect changing hydrologic processes.
Important near-term goals of the overall effort include updating the existing 100-year flood elevations using climate model projections and identifying additional monitoring stations needed to track changes. DEP will also establish a system for reporting the impacts of extreme weather events on the City’s watershed and infrastructure. In the immediate future, DEP will evaluate flood protection measures for three existing water pollution control plants that are scheduled for renovation.63
Spotlight on the Colorado River
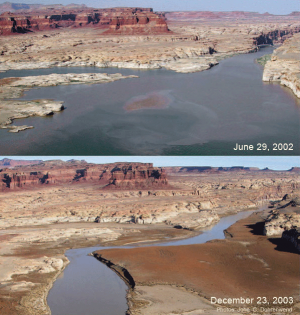 Matching photographs taken 18 months apart during the most serious period of recent drought show a significant decrease in Lake Powell.The Colorado River system supplies water to over 30 million people in the Southwest including Los Angeles, Phoenix, Las Vegas, and Denver. Reservoirs in the system, including the giant lakes Mead and Powell, were nearly full in 1999, with almost four times the annual flow of the river stored. By 2007, the system had lost approximately half of that storage after enduring the worst drought in 100 years of record keeping.64 Runoff was reduced due to low winter precipitation, and warm, dry, and windy spring seasons that substantially reduced snowpack.
Change in Water Volume of Lakes Mead and Powell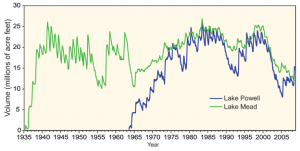 The filling of Lake Mead (green) was initiated in 1935, and that of Lake Powell (blue) in 1963. In 1999, the lakes were nearly full, but by 2007, the lakes had lost nearly half of their storage water after the worst drought in 100 years. Image Reference: USBR38
Numerous studies over the last 30 years have indicated that the river is likely at least two-thirds chance of occurring to experience reductions in runoff due to climate change. In addition, diversions from the river to meet the needs of cities and agriculture are approaching its average flow. Under current conditions, even without climate change, large year-to-year fluctuations in reservoir storage are possible.18 If reductions in flow projected to accompany global climate change occur, water managers will be challenged to satisfy all existing demands, let alone the increasing demands of a rapidly growing population.34,65
Efforts are underway to address these challenges. In 2005, the Department of Interior’s Bureau of Reclamation began a process to formalize operating rules for lakes Mead and Powell during times of low flows and to apportion limited water among the states.66
Water and Energy Connections
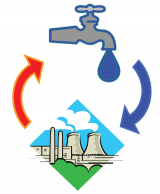 Water cycleWater and energy are tightly interconnected; water systems use large amounts of energy, and energy systems use large amounts of water. Both are expected to be under increasing pressure in the future and both will be affected by a changing climate. In the energy sector, water is used directly for hydropower, and cooling water is critical for nearly all other forms of electrical power generation. Withdrawals of freshwater used to cool power plants that use heat to generate electricity are very large, nearly equaling the water withdrawn for irrigation. Water consumption by power plants is about 20 percent of all non-agricultural uses, or half that of all domestic use.67
In the water sector, two very unusual attributes of water, significant weight due to its relatively high density, and high heat capacity, make water use energy intensive. Large amounts of energy are needed for pumping, heating, and treating drinking water and wastewater. Water supply and treatment consumes roughly 4 percent of the nation’s power supply, and electricity accounts for about 75 percent of the cost of municipal water processing and transport. In California, 30 percent of all non-power plant natural gas is used for water-related activities.68,69 The energy required to provide water depends on its source (groundwater, surface water, desalinated water, treated wastewater, or recycled water), the distance the water is conveyed, the amount of water moved, and the local topography. Surface water often requires more treatment than groundwater. Desalination requires large amounts of energy to produce freshwater. Treated wastewater and recycled water (used primarily for agriculture and industry) require energy for treatment, but little energy for supply and conveyance. Conserving water has the dual benefit of conserving energy and potentially reducing greenhouse gas emissions if fossil fuels are the predominant source of that energy
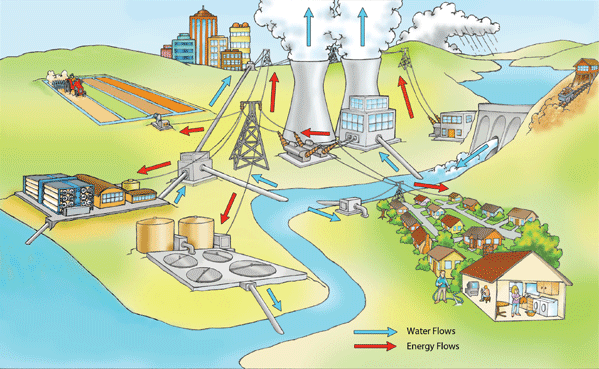 Water and energy are intimately connected. Water is used by the power generation sector for cooling, and energy is used by the water sector for pumping, drinking water treatment, and wastewater treatment. Without energy, there would be limited water distribution, and without water, there would be limited energy production. Image Reference: U.S. DOE67
Primary Sources
References
- 1. a. b. c. d. e. f. g. h. i. j. [142] Climate Change and Water In Technical Paper of the Intergovernmental Panel on Climate Change, Edited by B. C. Bates, Z. W. Kundzewicz, S. Wu and J. P. Palutikof. Geneva, Switzerland, 2008.
- 2. a. b. c. d. [68] Gutowski, W. J., G. C. Hegerl, G. J. Holland, T. R. Knutson, L. Mearns, R. J. Stouffer, P. J. Webster, M. F. Wehner, and F. W. Zwiers. "Causes of Observed Changes in Extremes and Projections of Future Changes." In Weather and Climate Extremes in a Changing Climate: Regions of Focus: North America, Hawaii, Caribbean, and U.S. Pacific Islands, edited by T. R. Karl, G. A. Meehl, C. D. Miller, S. J. Hassol, A. M. Waple and W. L. Murray, 81-116. Vol. Synthesis and Assessment Product 3.3. Washington, D.C.: U.S. Climate Change Science Program, 2008.
- 3. a. b. [49] Hegerl, G. C., F. W. Zwiers, P. Braconnot, N. Gillett, Y. Luo, J. A. Marengo Orsini, N. Nicholls, J. E. Penner, and P. A. Stott. "Understanding and Attributing Climate Change." In Climate Change 2007: The Physical Science Basis, edited by S. Solomon, D. Qin, M. Manning, Z. Chen, M. Marquis, K. B. Averyt, M. Tignor and H. L. Miller, 663-745. Vol. Contribution of Working Group I to the Fourth Assessment Report of the Intergovernmental Panel on Climate Change. Cambridge, UK and New York, NY: Cambridge University Press, 2007.
- 4. [108] Christensen, J. H., B. Hewitson, A. Busuioc, A. Chen, X. Gao, R. Held, R. Jones, R. K. Kolli, W. - T. Kwon, R. Laprise et al. "Regional climate projections." In Climate Change 2007: The Physical Science Basis, edited by S. Solomon, D. Qin, M. Manning, Z. Chen, M. Marquis, K. B. Averyt, M. Tignor and H. L. Miller, 847-940. Vol. Contribution of Working Group I to the Fourth Assessment Report of the Intergovernmental Panel on Climate Change. Cambridge UK and New York, NY: Cambridge University Press, 2007.
- 5. a. b. c. [143] Feng, S., and Q. Hu. "Changes in Winter Snowfall/Precipitation Ratio in the Contiguous United States." Journal of Geophysical Research-Atmospheres 112 (2007): -.
- 6. a. b. [144] Guttman, N. B., and R. G. Quayle. "A Historical Perspective of U.S. Climate Divisions." Bulletin of the American Meteorological Society 77, no. 2 (1996): 293-303.
- 7. a. b. [145] Groisman, P.Ya., R. W. Knight, D. R. Easterling, T. R. Karl, G. C. Hegerl, and V. N. Razuvaev. "Trends in Intense Precipitation in the Climate Record." Journal of Climate 18, no. 9 (2005): 1326-1350.
- 8. [112] Kunkel, K., P. D. Bromirski, H. E. Brooks, T. Cavazos, A. V. Douglas, D. R. Easterling, K. Emanuel, P.Ya. Groisman, G. J. Holland, T. R. Knutson et al. "Observed Changes in Weather and Climate Extremes." In Weather and Climate Extremes in a Changing Climate: Regions of Focus: North America, Hawaii, Caribbean, and U.S. Pacific Islands, edited by T. R. Karl, G. A. Meehl, C. D. Miller, S. J. Hassol, A. M. Waple and W. L. Murray, 35-80. Vol. CCSP Synthesis and Assessment Product 3.3. Washington, D.C.: U.S. Climate Change Science Program, 2008.
- 9. a. b. c. d. e. [146] Kundzewicz, Z. W., L. J. Mata, N. W. Arnell, P. Doll, P. Dabat, B. Jimenez, K. A. Miller, T. Oki, Z. Sen, and I. A. Shiklomanov. "Freshwater Resources and Their Management." In Climate Change 2007: Impacts, Adaptation and Vulnerability, edited by M. L. Parry, O. F. Canziani, J. P. Palutikof, P. J. van der Linden and C. E. Hanson, 173-210. Vol. Contribution of Working Group II to the Fourth Assessment Report of the Intergovernmental Panel on Climate Change. Cambridge, UK and New York, NY: Cambridge University Press, 2007.
- 10. [147] Groisman, P.Ya., and R. W. Knight. "Prolonged Dry Episodes over the Conterminous United States : New Tendencies Emerging during the Last 40 Years." 21, no. 9 (2008): 1850-1862.
- 11. [90] Meehl, G. A., T. F. Stocker, W. D. Collins, P. Friedlingstein, A. T. Gaye, JM Gregory, A. Kitoh, R. Knutti, J. M. Murphy, A. Noda et al. "Global Climate Projections." In Climate Change 2007: The Physical Basis, edited by S. Solomon, D. Qin, M. Manning, Z. Chen, M. Marquis, K. B. Averyt, M. Tignor and H. L. Miller, 747-845. Vol. Contribution of Working Group I to the Fourth Assessment Report of the Intergovernmental Panel on Climate Change. Cambridge, UK and New York, NY: Cambridge University Press, 2007.
- 12. [148] Tebaldi, C., K. Hayhoe, J. M. Arblaster, and G. A. Meehl. "Going to the Extremes: An Intercomparison of Model-simulated Historical and Future Changes in Extreme Events." Climatic Change 79, no. 3-4 (2006): 185-211.
- 13. a. b. [91] various. footnote 91., 2009.
- 14. a. b. c. [151] Milly, P. C. D., J. Betancourt, M. Falkenmark, R. M. Hirsch, Z. W. Kundzewicz, D. P. Lettenmaier, and R. J. Stouffer. "Stationarity Is Dead: Whither Water Management?" Science 319, no. 5863 (2008): 573-574.
- 15. a. b. c. d. e. f. [149] Lettenmaier, D., D. Major, L. Poff, and S. Running. "Water Resources." In The Effects of Climate Change on Agriculture, Land Resources, Water Resources and Biodiversity in the United States, edited by P. Backlund, A. Janetos, D. Schimel, J. Hatfield, K. Boote, P. Fay, L. Hahn, C. Izaurralde, B. A. Kimball, T. Mader et al., 121-150. Vol. Synthesis and Assessment Product 4.3. Washington, D.C.: U.S. Department of Agriculture, 2008.
- 16. a. b. [150] Hayhoe, K., C. P. Wake, T. G. Huntington, L. F. Luo, M. D. Schwartz, J. Sheffield, E. Wood, B. Anderson, J. Bradbury, A. DeGaetano et al. "Past and Future Changes in Climate and Hydrological Indicators in the U.S. Northeast." Climate Dynamics 28, no. 4 (2007): 381-407.
- 17. [115] Seager, R., M. Ting, I. Held, Y. Kushnir, J. Lu, G. Vecchi, H. - P. Huang, N. Harnik, A. Leetmaa, N. - C. Lau et al. "Model Projections of an Imminent Transition to a More Arid Climate in Southwestern North America." Science 316, no. 5828 (2007): 1181-1184.
- 18. a. b. [152] Christensen, N. S., A. W. Wood, N. Voisin, D. P. Lettenmaier, and R. N. Palmer. "The Effects of Climate Change on the Hydrology and Water Resources of the Colorado River Basin." Climatic Change 62, no. 1-3 (2004): 337-363.
- 19. a. b. c. [157] Stewart, I. T., D. R. Cayan, and M. D. Dettinger. "Changes in Snowmelt Runoff Timing in Western North America under a 'Business as Usual' Climate Change Scenario." Climatic Change 62, no. 1-3 (2004): 217-232.
- 20. [153] Mote, P., A. Hamlet, and E. Salathe. "Has Spring Snowpack Declined in the Washington Cascades?" Hydrology and Earth System Sciences 12, no. 1 (2008): 193-206.
- 21. [154] Knowles, N., M. D. Dettinger, and D. R. Cayan. "Trends in Snowfall Versus Rainfall in the Western United States." Journal of Climate 19, no. 18 (2006): 4545-4559.
- 22. [155] Huntington, T. G., G. A. Hodgkins, B. D. Keim, and R. W. Dudley. "Changes in the Proportion of Precipitation Occurring as Snow in New England (1949-2000)." Journal of Climate 17, no. 13 (2004): 2626-2636.
- 23. [156] Burakowski, E. A., C. P. Wake, B. Braswell, and D. P. Brown. "Trends in Wintertime Climate in the Northeastern United States: 1965-2005." Journal of Geophysical Research-Atmospheres 113 (2008).
- 24. [158] Stewart, I. T., D. R. Cayan, and M. D. Dettinger. "Changes Toward Earlier Streamflow Timing across Western North America." Journal of Climate 18, no. 8 (2005): 1136-1155.
- 25. [159] Rauscher, S. A., J. S. Pal, N. S. Diffenbaugh, and M. M. Benedetti. "Future Changes in Snowmelt-driven Runoff Timing over the Western United States." Geophysical Research Letters 35 (2008): -.
- 26. [34] Barnett, T. P., D. W. Pierce, H. G. Hidalgo, C. Bonfils, B. D. Santer, T. Das, G. Bala, A. W. Wood, T. Nozawa, A. A. Mirin et al. "Human-induced changes in the hydrology of the western United States." Science 319, no. 5866 (2008): 1080-1083.
- 27. [160] Pierce, D. W., T. P. Barnett, H. G. Hidalgo, T. Das, C. Bonfils, B. D. Santer, G. Bala, M. D. Dettinger, D. R. Cayan, A. Mirin et al. "Attribution of Declining Western U.S. Snowpack to Human Effects." Journal of Climate 21, no. 23 (2008): 6425-6444.
- 28. [161] Bonfils, C., B. D. Santer, D. W. Pierce, H. G. Hidalgo, G. Bala, T. Das, T. P. Barnett, D. R. Cayan, C. Doutriaux, A. W. Wood et al. "Detection and Attribution of Temperature Changes in the Mountainous Western United States." Journal of Climate 21, no. 23 (2008): 6404-6424.
- 29. [166] Austin, J. A., and S. M. Colman. "Lake Superior Summer Water Temperatures Are Increasing More Rapidly Than Regional Air Temperatures: A Positive Ice-albedo Feedback." Geophysical Research Letters 34 (2007).
- 30. [162] EPA. National Water Program Strategy: Response to Climate Change. Washington, D.C.: U.S. Environmental Protection Agency, 2008.
- 31. a. b. [163] Ebi, K. L., J. Balbus, P. L. Kinney, E. Lipp, D. M. Mills, M. S. O'Neill, and M. Wilson. "Effects of Global Change on Human Health." In Analyses of the Effects of Global Change on Human Health and Welfare and Human Systems, edited by J. L. Gamble, 39-87. Vol. Synthesis and Assessment Product 4.6. Washington, D.C.: U.S. Environmental Protection Agency, 2008.
- 32. a. b. c. [164] Field, C., L. D. Mortsch, M. Brklacich, D. L. Forbes, P. Kovacs, J. A. Patz, S. W. Running, and M. J. Scott. "North America." In Climate Change 2007: Impacts Adaptation and Vulnerabiltiy, edited by M. L. Parry, O. F. Canziani, J. P. Palutikof, P. J. van der Linden and C. E. Hanson, 617-652. Vol. Contribution of Working Group II to the Fourth Assessment Report of the Intergovernmental Panel on Climate Change. Cambridge, UK and New York, NY: Cambridge University Press, 2007.
- 33. [165] Winter, J., J. W. Harvey, O. L. Franke, and W. M. Alley. Ground Water and Surface Water: A Single Resource In USGS Circular 1139. Denver, CO: U.S. Geological Survey, 1998.
- 34. a. b. c. [167] Office, General Accounting U. S.. Freshwater Supply: States' Views of How Federal Agencies Could Help Them Meet the Challenges of Expected Shortages. Washington, D.C.: General Accounting Office, 2003.
- 35. a. b. [168] EPA. The Clean Water and Drinking Water Infrastructrue Gap Analysis. Washington, D.C.: U.S. Environmental Protection Agency, 2002.
- 36. [169] Council, National Research. Confronting the Nation's Water Problems: The Role of Research. Washington, D.C.: National Academies Press, 2004.
- 37. [170] Yohe, G., R. D. Lasco, Q. K. Ahmad, N. W. Arnell, S. J. Cohen, C. Hope, A. Janetos, and R. T. Perez. "Perspectives on Climate Change and Sustainability." In Climate Change 2007: Impacts, Adaptation and Vulnerability, edited by M. L. Parry, O. F. Canziani, J. P. Palutikof, P. J. van der Linden and C. E. Hanson, 811-841. Vol. Contribution fo Working Group II to the Fourth Assessment Report of the Intergovernmental Panel on Climate Change. Cambridge, UK and New York, NY: Cambridge University Press, 2007.
- 38. a. b. c. d. [171] of Reclamation, Bureau U. S.. Water 2025: Preventing Crises and Conflict in the West. Washington, D.C.: U.S. Bureau of Reclamation, 2005.
- 39. a. b. c. [172] Wilbanks, T. J., P. Romero-Lankao, M. Bao, F. Berkhout, S. Cairncross, J. - P. Ceron, M. Kapshe, R. Muir-Wood, and R. Zapata-Marti. "Industry, Settlement and Society." In Climate Change 2007: Impacts, Adaptation and Vulnerability, edited by M. L. Parry, O. F. Canziani, J. P. Palutikof, P. J. van der Linden and C. E. Hanson, 357-390. Vol. Contribution of Working Group II to the Fourth Assessment Report of the Intergovernmental Panel on Climate Change. Cambridge, UK and New York, NY: Cambridge University Press, 2007.
- 40. [173] Adger, W. N., S. Agrawala, M. M. Q. Mirza, C. Conde, K. O'Brien, J. Pulhin, R. Pulwarty, B. Smit, and K. Takahashi. "Assessment of Adaptation Practices, Options, Constraints and Capacity." In Climate Change 2007: Impacts, Adaptation and Vulnerability, edited by M. L. Parry, O. F. Canziani, J. P. Palutikof, P. J. van der Linden and C. E. Hanson, 717-743. Vol. Contribution of Working Group II to the Fourth Assessment Report of the Intergovernmental Panel on Climate Change. Cambridge, UK and New York, NY: Cambridge University Press, 2007.
- 41. a. b. [174] Hartmann, H. C.. "Decision Support for Water Resources Management." In Uses and Limitations of Observations, Data, Forecasts, and Other Projections in Decision Support for Selected Sectors and Regions, 45-55. Vol. Synthesis and Assessment Product 5.1. Washington, D.C.: U.S. Climate Change Science Program, 2008.
- 42. [175] Ruhl, J. B.. "Water Wars, Eastern Style: Divvying Up the Apalachicola-Chattahoochee-Flint River Basin." Journal of Contemporary Water Research & Education 131 (2005): 47-54.
- 43. [176] Leitman, S.. "Lessons Learned from Transboundary Management Efforts in the Apalachicola—Chattahoochee—Flint Basin, USA." In Transboundary Water Resources: A Foundation for Regional Stability in Central Asia, edited by J. Moerlins, M. Khankhasayev, S. Leitman and E. Makhmudov, 195-208. Vol. 39. NATO Security through Science Series 39. Dordrecht and London: Springer Netherlands, 2008.
- 44. [177] Gobalet, K. W., P. D. Schulz, T. A. Wake, and N. Siefkin. "Archaeological Perspectives on Native American Fisheries of California, with Emphasis on Steelhead and Salmon." Transactions of the American Fisheries Society 133, no. 4 (2004): 801-833.
- 45. [178] Hammersmark, C. T., W. E. Fleenor, and S. G. Schladow. "Simulation of Flood Impact and Habitat Extent for a Tidal Freshwater Marsh Restoration." Ecological Engineering 25, no. 2 (2005): 137-152.
- 46. [179] Kondolf, G., P. Angermeier, K. Cummins, T. Dunne, M. Healey, W. Kimmerer, P. Moyle, D. Murphy, D. Patten, S. Railsback et al. "Projecting Cumulative Benefits of Multiple River Restoration Projects: An Example from the Sacramento-San Joaquin River System in California." Environmental Management 42, no. 6 (2008): 933-945.
- 47. [180] McKee, L. J., N. Ganju, and D. Schoellhamer. "Estimates of Suspended-sediment Entering San Francisco Bay from the Sacramento and San Joaquin Delta, San Francisco Bay, California." Journal of Hydrology 323, no. 1-4 (2006): 335-352.
- 48. [181] Trenham, P. C., H. B. Shaffer, and P. B. Moyle. "Biochemical Identification and Assessment of Population Subdivision in Morphologically Similar Native and Invading Smelt Species (Hypomesus) in the Sacramento–San Joaquin Estuary, California." Transactions of the American Fisheries Society 127, no. 3 (1998): 417-424.
- 49. [182] Vengosh, A., J. Gill, M. L. Davisson, and G. B. Hudson. "A Multi-isotope (B, Sr, O, H, and C) and Age Dating (H-3-He-3 and C-14) Study of Groundwater from Salinas Valley, California: Hydrochemistry, Dynamics, and Contamination Processes." Water Resources Research 38, no. 1 (2002).
- 50. [183] Haggerty, G. M., D. Tave, R. Schmidt-Petersen, and J. Stomp. "Raising Endangered Fish in New Mexico." Southwest Hydrology 7, no. 4 (2008): 20-21.
- 51. [184] Council, National Research. Endangered and Threatened Fishes in the Klamath River Basin: Causes of Decline and Strategies for Recovery. Washington, D.C.: National Academies Press, 2004.
- 52. [185] Council, National Research. Hydrology, Ecology, and Fishes of the Klamath River Basin. Washington, D.C.: National Academies Press, 2008.
- 53. [186] Council, National Research. Colorado River Basin Water Management: Evaluating and Adjusting to Hydroclimatic Variability. Washington, D.C.: National Academies Press, 2007.
- 54. [187] of Reclamation, Bureau U. S.. Colorado River Interim Guidelines for Lower Basin Shortages and Coordinated Operations for Lake Powell and Lake Mead: Final Environmental Impact Statement. Vol. 4 Volumes. Boulder City, NV: U.S. Bureau of Reclamation, 2007.
- 55. [188] of Arizona, University. Native American Water Rights in Arizona., Submitted.
- 56. a. b. c. [189] Cook, E. R., CA Woodhouse, C. M. Eakin, D. M. Meko, and D. W. Stahle. "Long-term Aridity Changes in the Western United States." Science 306, no. 5698 (2004): 1015-1018.
- 57. [97] Cook, E. R., P. J. Bartlein, N. S. Diffenbaugh, R. Seager, B. N. Shuman, R. S. Webb, J. W. Williams, and CA Woodhouse. "Hydrological Variability and Change." In Abrupt Climate Change, 143-257. Vol. Synthesis and Assessment Product 3.4. Reston, VA: U.S. Geological Survey, 2008.
- 58. [191] Bull, S. R., D. E. Bilello, J. Ekmann, M. J. Sale, and D. K. Schmalzer. "Effects of Climate Change on Energy Production and Distribution in the United States." In Effects of Climate Change on Energy Production and Use in the United States, edited by T. J. Wilbanks, V. Bhatt, D. E. Bilello, S. R. Bull, J. Ekmann, W. C. Horak, Y. J. Huang, M. D. Levine, M. J. Sale, D. K. Schmalzer et al., 45-80. Vol. Synthesis and Assessment Product 4.5. Washington, D.C.: U.S. Climate Change Science Program, 2007.
- 59. [192] Hyman, R. C., J. R. Potter, M. J. Savonis, V. R. Burkett, and J. E. Tump. "Why Study Climate Change Impacts on Transportation?" In Impacts of Climate Change and Variability on Transportation Systems and Infrastructure: Gulf Coast Study, Phase I, edited by M. J. Savonis, V. R. Burkett and J. R. Potter, 1 to 1F-2 [48 pp.]. Vol. Synthesis and Assessment Product 4.7. Washington, D.C.: U.S. Department of Transportation, 2008.
- 60. [193] Hatfield, J., K. Boote, P. Fay, L. Hahn, C. Izaurralde, B. A. Kimball, T. Mader, J. Morgan, D. Ort, W. Polley et al. "Agriculture." In The Effects of Climate Change on Agriculture, Land Resources, and Biodiversity in the United States, edited by P. Backlund, A. Janetos, D. Schimel, J. Hatfield, K. Boote, P. Fay, L. Hahn, C. Izaurralde, B. A. Kimball, T. Mader et al., 21-74. Vol. Synthesis and Assessment Product 4.3. Washington, D.C.: U.S. Department of Agriculture, 2008.
- 61. [70] Janetos, A., L. Hansen, D. Inouye, B. P. Kelly, L. Meyerson, B. Peterson, and R. Shaw. "Biodiversity." In The Effects of Climate Change on Agriculture, Land Resources, Water Resources, and Biodiversity in the United States, edited by P. Backlund, A. Janetos, D. Schimel, J. Hatfield, K. Boote, P. Fay, L. Hahn, C. Izaurralde, B. A. Kimball, T. Mader et al., 151-181. Vol. Synthesis and Assessment Product 4.3. Washington, D.C.: U.S. Department of Agriculture, 2008.
- 62. [190] Ingram, H., D. Feldman, N. J. Mantua, K. L. Jacobs, D. Fort, N. Beller-Simms, and A. M. Waple. "The Changing Context." In Decision-Support Experiments and Evaluations Using Seasonal-to-Interannual Forecasts and Observational Data: A Focus on Water Resources, edited by N. Beller-Simms, H. Ingram, D. Feldman, N. J. Mantua, K. L. Jacobs and A. M. Waple, 7-28. Vol. Synthesis and Assessment Product 5.3. Asheville, NC: NOAA's National Climatic Data Center, 2008.
- 63. [194] Feldman, D. L., K. L. Jacobs, G. Garfin, A. Georgakakos, B. Morehouse, P. Restrepo, R. S. Webb, B. Yarnal, D. Basketfield, H. C. Hartmann et al. "Making Decision-Support Information Useful, Useable, and Responsive to Decision-Maker Needs." In Decision-Support Experiments and Evaluations Using Seasonal-to-Interannual Forecasts and Observationa Data: A Focus on Water Resources, edited by N. Beller-Simms, H. Ingram, D. Feldman, N. J. Mantua, K. L. Jacobs and A. M. Waple, 101-140. Vol. Synthesis and Assessment Product 5.3. Asheville, NC: NOAA's National Climatic Data Center, 2008.
- 64. [29] Steffen, K., P. U. Clark, J. G. Cogley, D. Holland, S. Marshall, E. Rignot, and R. H. Thomas. "Rapid Changes in Glaciers and Ice Sheets and Their Impacts on Sea Level." In Abrupt Climate Change, 60-142. Vol. Synthesis and Assessment Product 3.4. Reston, VA: U.S. Geological Survey, 2008.
- 65. [195] McCabe, G. J., and D. M. Wolock. "Warming May Create Substantial Water Supply Shortages in the Colorado River Basin." Geophysical Research Letters 34 (2007): -.
- 66. [196] "Appendix U: Climate Techinical Work Group Report: Review of Science and Methods for Incorporating Climate Change Information into Bureau of Reclamation's Colorado River Basin Planning Studies." In Colorado River Interim Guidelines for Lower Basin Shortages and Coordinated Operations for Lake Powell and Lake Mead: Final Environmental Impact Statement, edited by L. Brekke, B. Harding, T. Piechota, B. Udall, CA Woodhouse and D. Yates, 110 pp. Boulder City, NV: U.S. Bureau of Reclamation, 2007.
- 67. a. b. [197] of Energy, Department U. S.. Energy Demands on Water Resources In Report to Congress on the Interdependency of Energy and Water. Albuquerque, NM: Sandia National Laboratories, 2006.
- 68. [198] Commission, California Energy. California's Water - Energy Relationship. Sacramento, CA: California Energy Commission, 2005.
- 69. [199] Commission, California Energy. Refining Estimates of Water-related Energy Use in California. Sacramento, CA: California Energy Commission, 2006.