The content of this website is no longer being updated. For information on current assessment activities, please visit http://www.globalchange.gov/what-we-do/assessment
National Climate Change
Key Messages:
- U.S. average temperature has risen more than 2ºF over the past 50 years and is projected to rise more in the future; how much more depends primarily on the amount of heat-trapping gases emitted globally and how sensitive the climate is to those emissions.
- Precipitation has increased an average of about 5 percent over the past 50 years. Projections of future precipitation generally indicate that northern areas will become wetter, and southern areas, particularly in the West, will become drier.
- The amount of rain falling in the heaviest downpours has increased approximately 20 percent on average in the past century, and this trend is very likelyat least a 90% chance of occurring to continue, with the largest increases in the wettest places.
- Many types of extreme weather events, such as heat waves and regional droughts, have become more frequent and intense during the past 40 to 50 years.
- The destructive energy of Atlantic hurricanes has increased in recent decades. The intensity of these storms is likelyat least two-thirds chance of occurring to increase in this century.
- In the eastern Pacific, the strongest hurricanes have become stronger since the 1980s, even while the total number of storms has decreased.
- Sea level has risen along most of the U.S. coast over the last 50 years, and will rise more in the future.
- Cold-season storm tracks are shifting northward and the strongest storms are likelyat least two-thirds chance of occurring to become stronger and more frequent.
- Arctic sea ice is declining rapidly and this is very likelyat least a 90% chance of occurring to continue.
Hottest Years on Record in the U.S. The maps show annual temperature difference from the 1961-1990 average for the 3 years that were the hottest on record in the United States: 1998, 1934 and 2006 (in rank order). Red areas were warmer than average, blue were cooler than average. The 1930s were very warm in much of the United States, but they were not unusually warm globally. On the other hand, the warmth of 1998 and 2006, as for most years in recent decades, has been global in extent. Image Reference: Smith1
Like the rest of the world, the United States has been warming significantly over the past 50 years in response to the build up of heat-trapping gases in the atmosphere. When looking at national climate, however, it is important to recognize that climate responds to local, regional, and global factors. Therefore, national climate varies more than the average global climate. While various parts of the world have had particularly hot or cold periods earlier in the historical record, these periods have not been global in scale, whereas the warming of recent decades has been global in scale – hence the term global warming. It is also important to recognize that at both the global and national scales, year-to-year fluctuations in natural weather and climate patterns can produce a period that does not follow the long-term trend. Thus, each year will not necessarily be warmer than every year before it, though the warming trend continues.
Annual Average Temperature (Departure from the 1901-2000 Average)") From 1901 to 2008, each year’s temperature departure from the long-term average is one bar, with blue bars representing years cooler than the long-term average and red bars representing years warmer than that average. National temperatures vary much more than global temperatures, in part because of the moderating influence of the oceans on global temperatures. Image References: NOAA/NCDC2 (left); Smith1 (right)
From 1901 to 2008, each year’s temperature departure from the long-term average is one bar, with blue bars representing years cooler than the long-term average and red bars representing years warmer than that average. National temperatures vary much more than global temperatures, in part because of the moderating influence of the oceans on global temperatures. Image References: NOAA/NCDC2 (left); Smith1 (right)
Temperature Trends
U.S. average temperature has risen more than 2°F over the past 50 years and is projected to rise more in the future; how much more depends primarily on the amount of heat-trapping gases emitted globally and how sensitive the climate is to those emissions.
The series of maps and thermometers below shows the magnitude of the observed and projected changes in annual average temperature. The map for the period around 2000 shows that most areas of the United States have warmed 1 to 2°F compared to the 1960s and 1970s. Although not reflected in these maps of annual average temperature, this warming has generally resulted in longer warm seasons and shorter, less intense cold seasons.
The remaining maps show projected warming over the course of this century under a lower emissions scenario and a higher emissions scenario3 (see Global Climate Change section). Temperatures will continue to rise throughout the century under both emissions scenarios,3 although higher emissions result in more warming by the middle of the century and significantly more by the end of the century.
Temperature increases in the next couple of decades will be primarily determined by past emissions of heat-trapping gases. As a result, there is little difference in projected temperature between the higher and lower emissions scenarios3 in the near-term (around 2020), so only a single map is shown for this timeframe. Increases after the next couple of decades will be primarily determined by future emissions.4 This is clearly evident in greater projected warming in the higher emissions scenario3 by the middle (around 2050) and end of this century (around 2090).
On a seasonal basis, most of the United States is projected to experience greater warming in summer than in winter, while Alaska experiences far more warming in winter than summer.5
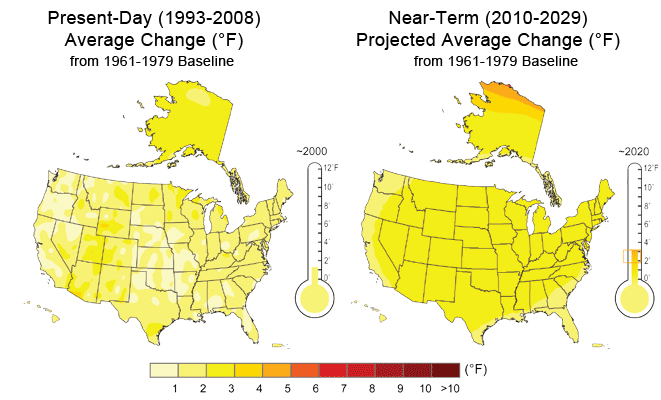 The maps and thermometers in this figure and in the figure below show temperature differences (either measured or projected) from conditions as they existed during the period from 1961-1979. Comparisons to this period are made because the influence on climate from increasing greenhouse gas emissions has been greatest during the past five decades. The present-day map is based on the average observed temperatures from 1993-2008 minus the average from 1961-1979. Projected temperatures are based on results from 16 climate models for the periods 2010-2029, 2040-2059, and 2080-2099. The brackets on the thermometers represent the likely range of model projections, though lower or higher outcomes are possible. The mid-century and end-of-century maps show projections for both the higher and lower emission scenarios.3 The projection for the near-term is the average of the higher and lower emission scenarios3 because there is little difference in that timeframe. Image References: NOAA/NCDC2 (left); CMIP3-C6 (right)
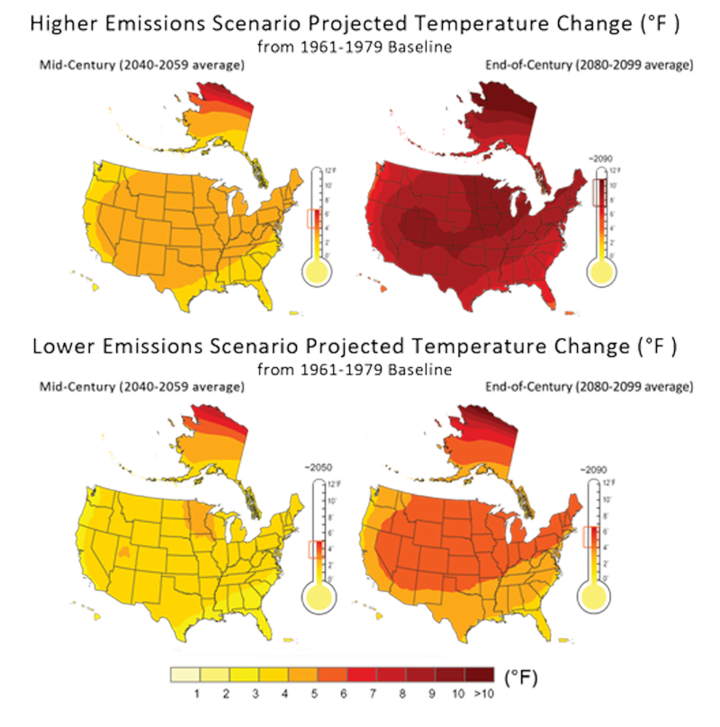 The maps shown here and in the figure above are based on projections of future temperature by 16 of the Coupled Model Intercomparison Project Three (CMIP3) climate models using two emissions scenarios from the Intergovernmental Panel on Climate Change (IPCC), Special Report on Emissions Scenarios (SRES).3 The “lower” scenario here is B1, while the “higher” is A2.3 The brackets on the thermometers represent the likely range of model projections, though lower or higher outcomes are possible. Additional information on these scenarios is under Emissions Scenarios in the Global Climate Change section. These maps, and others in this report, show projections at national, regional, and sub-regional scales, using well-established techniques.7 Image Reference: CMIP3-C6
The average warming for the country as a whole is shown on the thermometers adjacent to each map. By the end of the century, the average U.S. temperature is projected to increase by approximately 7 to 11°F under the higher emissions scenario3 and by approximately 4 to 6.5°F under the lower emissions scenario.3 These ranges are due to differences among climate model results for the same emissions scenarios. Emissions scenarios even lower than the lower scenario shown here, such as the 450 ppm stabilization scenario described in the Global Climate Change section, would yield lower temperature increases than those shown above.8
Precipitation Patterns
Precipitation has increased an average of about 5 percent over the past 50 years. Projections of future precipitation generally indicate that northern areas will become wetter, and southern areas, particularly in the West, will become drier.
Observed Changes in Annual Average Precipitation 1958-2008 While U.S. annual average precipitation has increased about 5 percent over the past 50 years, there have been important regional differences as shown above. Image Reference: NOAA/NCDC9While precipitation over the United States as a whole has increased, there have been important regional and seasonal differences. Increasing trends throughout much of the year have been predominant in the Northeast and large parts of the Plains and Midwest. Decreases occurred in much of the Southeast in all but the fall season and in the Northwest in all seasons except spring. Precipitation also generally decreased during the summer and fall in the Southwest, while winter and spring, which are the wettest seasons in states such as California and Nevada, have had increases in precipitation.9
Future changes in total precipitation due to human-induced warming are more difficult to project than changes in temperature. In some seasons, some areas will experience an increase in precipitation, other areas will experience a decrease, and others will see little discernible change. The difficulty arises in predicting the extent of those areas and the amount of change. Model projections of future precipitation generally indicate that northern areas will become wetter, and southern areas, particularly in the West, will become drier.10,5
Projected Change in North American Precipitation by 2080-2099 The maps show projected future changes in precipitation relative to the recent past as simulated by 15 climate models. The simulations are for late this century, under a higher emissions scenario.3 For example, in the spring, climate models agree that northern areas are likely to get wetter, and southern areas drier. There is less confidence in exactly where the transition between wetter and drier areas will occur. Confidence in the projected changes is highest in the hatched areas. Image Reference: CMIP3-A11
Confidence in projected changes is higher for winter and spring than for summer and fall. In winter and spring, northern areas are expected to receive significantly more precipitation than they do now, because the interaction of warm and moist air coming from the south with colder air from the north is projected to occur farther north than it did on average in the last century. The more northward incursions of warmer and moister air masses are expected to be particularly noticeable in northern regions that will change from very cold and dry atmospheric conditions to warmer but moister conditions.12 Alaska, the Great Plains, the upper Midwest, and the Northeast are beginning to experience such changes for at least part of the year, with the likelihood of these changes increasing over time.
In some northern areas, warmer conditions will result in more precipitation falling as rain and less as snow. In addition, potential water resource benefits from increasing precipitation could be countered by the competing influences of increasing evaporation and runoff. In southern areas, significant reductions in precipitation are projected in winter and spring as the subtropical dry belt expands.5 This is particularly pronounced in the Southwest, where it would have serious ramifications for water resources.
Extreme Precipitation
The amount of rain falling in the heaviest downpours has increased approximately 20 percent on average in the past century, and this trend is very likelyat least a 90% chance of occurring to continue, with the largest increases in the wettest places.
Increases in Amounts of Very Heavy Precipitation (1958 to 2007)") The map shows percent increases in the amount falling in very heavy precipitation events (defined as the heaviest 1 percent of all daily events) from 1958 to 2007 for each region. There are clear trends toward more very heavy precipitation for the nation as a whole, and particularly in the Northeast and Midwest. Image Source: updated from Groisman et al.13One of the clearest precipitation trends in the United States is the increasing frequency and intensity of heavy downpours. This increase was responsible for most of the observed increase in overall precipitation during the last 50 years. In fact, there has been little change or a decrease in the frequency of light and moderate precipitation during the past 30 years, while heavy precipitation has increased. In addition, while total average precipitation over the nation as a whole increased by about 7 percent over the past century, the amount of precipitation falling in the heaviest 1 percent of rain events increased nearly 20 percent.14
The map shows percent increases in the amount falling in very heavy precipitation events (defined as the heaviest 1 percent of all daily events) from 1958 to 2007 for each region. There are clear trends toward more very heavy precipitation for the nation as a whole, and particularly in the Northeast and Midwest. Image Source: updated from Groisman et al.13One of the clearest precipitation trends in the United States is the increasing frequency and intensity of heavy downpours. This increase was responsible for most of the observed increase in overall precipitation during the last 50 years. In fact, there has been little change or a decrease in the frequency of light and moderate precipitation during the past 30 years, while heavy precipitation has increased. In addition, while total average precipitation over the nation as a whole increased by about 7 percent over the past century, the amount of precipitation falling in the heaviest 1 percent of rain events increased nearly 20 percent.14
During the past 50 years, the greatest increases in heavy precipitation occurred in the Northeast and the Midwest. There have also been increases in heavy downpours in the other regions of the continental United States, as well as Alaska, Hawaii, and Puerto Rico.14
Projected Changes in Light, Moderate, and Heavy Precipitation (by 2090s)") The figure shows projected changes from the 1990s average to the 2090s average in the amount of precipitation falling in light, moderate, and heavy events in North America. Projected changes are displayed in 5 percent increments from the lightest drizzles to the heaviest downpours. As shown here, the lightest precipitation is projected to decrease, while the heaviest will increase, continuing the observed trend. The higher emission scenario3 yields larger changes. Projections are based on the models used in the IPCC 2007 Fourth Assessment Report. Image Reference: CCSP SAP 3.312
The figure shows projected changes from the 1990s average to the 2090s average in the amount of precipitation falling in light, moderate, and heavy events in North America. Projected changes are displayed in 5 percent increments from the lightest drizzles to the heaviest downpours. As shown here, the lightest precipitation is projected to decrease, while the heaviest will increase, continuing the observed trend. The higher emission scenario3 yields larger changes. Projections are based on the models used in the IPCC 2007 Fourth Assessment Report. Image Reference: CCSP SAP 3.312
Climate models project continued increases in the heaviest downpours during this century, while the lightest precipitation is projected to decrease. Heavy downpours that are now 1-in-20-year occurrences are projected to occur about every 4 to 15 years by the end of this century, depending on location, and the intensity of heavy downpours is also expected to increase. The 1-in-20-year heavy downpour is expected to be between 10 and 25 percent heavier by the end of the century than it is now.14
Changes in these kinds of extreme weather and climate events are among the most serious challenges to our nation in coping with a changing climate.
Drought and Heat Waves
Many types of extreme weather events, such as heat waves and regional droughts, have become more frequent and intense during the past 40 to 50 years.
Many extremes and their associated impacts are now changing. For example, in recent decades most of North America has been experiencing more unusually hot days and nights, fewer unusually cold days and nights, and fewer frost days. Droughts are becoming more severe in some regions. The power and frequency of Atlantic hurricanes have increased substantially in recent decades. The number of North American mainland landfalling hurricanes does not appear to have increased over the past century. Outside the tropics, cold-season storm tracks are shifting northward and the strongest storms are becoming even stronger. These trends in storms outside the tropics are projected to continue throughout this century.12,14,15
Drought
Like precipitation, trends in drought have strong regional variations. In much of the Southeast and large parts of the West, the frequency of drought has increased coincident with rising temperatures over the past 50 years. In other regions, such as the Midwest and Great Plains, there has been a reduction in drought frequency.
Observed Spring Snowmelt Dates Date of onset of spring runoff pulse. Reddish-brown circles indicate significant trends toward onsets more than 20 days earlier. Lighter circles indicate less advance of the onset. Blue circles indicate later onset. The changes depend on a number of factors in addition to temperature, including altitude and timing of snowfall. Image Reference: USGS16Although there has been an overall increase in precipitation and no clear trend in drought for the nation as a whole, increasing temperatures have made droughts more severe and widespread than they would have otherwise been. Without the observed increase in precipitation, higher temperatures would have led to an increase in the area of the contiguous United States in severe to extreme drought, with some estimates of a 30 percent increase.14 In the future, droughts are likelyat least two-thirds chance of occurring to become more frequent and severe in some regions.12 The Southwest, in particular, is expected to experience increasing drought as changes in atmospheric circulation patterns cause the dry zone just outside the tropics to expand farther northward into the United States.10
Rising temperatures have also led to earlier melting of the snowpack in the western United States.17 Because snowpack runoff is critical to the water resources in the western United States, changes in the timing and amount of runoff can exacerbate problems with already limited water supplies in the region.
Heat waves
Projected Frequency of Extreme Heat (2080-2099 Average)") Simulations for 2080-2099 indicate how currently rare extremes (a 1-in-20-year event) are projected to become more commonplace. A day so hot that it is currently experienced once every 20 years would occur every other year or more frequently by the end of the century under the higher emissions scenario.3 Image Reference: CMIP3-A11A heat wave is a period of several days to weeks of abnormally hot weather, often with high humidity. During the 1930s, there was a high frequency of heat waves due to high daytime temperatures resulting in large part from an extended multi-year period of intense drought. By contrast, in the past 3 to 4 decades, there has been an increasing trend in high-humidity heat waves, which are characterized by the persistence of extremely high nighttime temperatures.14
Simulations for 2080-2099 indicate how currently rare extremes (a 1-in-20-year event) are projected to become more commonplace. A day so hot that it is currently experienced once every 20 years would occur every other year or more frequently by the end of the century under the higher emissions scenario.3 Image Reference: CMIP3-A11A heat wave is a period of several days to weeks of abnormally hot weather, often with high humidity. During the 1930s, there was a high frequency of heat waves due to high daytime temperatures resulting in large part from an extended multi-year period of intense drought. By contrast, in the past 3 to 4 decades, there has been an increasing trend in high-humidity heat waves, which are characterized by the persistence of extremely high nighttime temperatures.14
Days Above 90°F The average number of days per year when the maximum temperature exceeded 90°F from 1961-1979 (top) and the projected number of days per year above 90°F by the 2080s and 2090s for lower emissions (middle) and higher emissions (bottom).91 Much of the southern United States is projected to have more than twice as many days per year above 90°F by the end of this century. Image Reference: CMIP3-B18
As average temperatures continue to rise throughout this century, the frequency of cold extremes will decrease and the frequency and intensity of high temperature extremes will increase.19 The number of days with high temperatures above 90°F is projected to increase throughout the country as illustrated in the maps on the right. Parts of the South that currently have about 60 days per year withtemperatures over 90°F are projected to experience 150 or more days a year above 90°F by the end of this century, under a higher emissions scenario.3 There is higher confidence in the regional patterns than in results for any specific location (see An Agenda for Climate Impacts Science section).
With rising high temperatures, extreme heat waves that are currently considered rare will occur more frequently in the future. Recent studies using an ensemble of models show that events that now occur once every 20 years are projected to occur about every other year in much of the country by the end of this century. In addition to occurring more frequently, at the end of this century these very hot days are projected to be about 10°F hotter than they are today.12
Atlantic Tropical Storms
The destructive energy of Atlantic hurricanes has increased in recent decades. The intensity of these storms is likelyat least two-thirds chance of occurring to increase in this century.
Atlantic Tropical Storms and Hurricanes Total numbers of North Atlantic named storms (tropical storms and hurricanes) (black) and total U.S. landfalling hurricanes (yellow) in 5-year periods based on annual data from 1881 to 2008. The bar for the last 5-year period is based on the assumption that the level of activity from 2006 to 2008 persists through 2010. In the era before satellites, indicated by the arrow above, the total number of named storms is less certain and has been adjusted upward to account for missing storms. Adjustments are based on relationships established during the satellite era between the number of observed storms and the number that would have been missed if satellite data had not been available. Image Reference: NOAA20Of all the world’s tropical storm and hurricane basins, the North Atlantic has been the most thoroughly monitored and studied. The advent of routine aircraft monitoring in the 1940s and the use of satellite observations since the 1960s have greatly aided monitoring of tropical storms and hurricanes. In addition, observations of tropical storm and hurricane strength made from island and mainland weather stations and from ships at sea began in the 1800s and continue today. Because of new and evolving observing techniques and technologies, scientists pay careful attention to ensuring consistency in tropical storm and hurricane records from the earliest manual observations to today’s automated measurements. This is accomplished through collection, analysis, and cross-referencing of data from numerous sources and, where necessary, the application of adjustment techniques to account for differences in observing and reporting methodologies through time. Nevertheless, data uncertainty is larger in the early part of the record. Confidence in the tropical storm and hurricane record increases after 1900 and is greatest during the satellite era, from 1965 to the present.14
Atlantic Basin Strongest Hurricanes Total number of strongest (Category 4 and 5) North Atlantic basin hurricanes (purple) and strongest U.S. landfalling hurricanes (orange) in 5-year periods based on annual data from 1946 to 2008. The bar for the last 5-year period is based on the assumption that the level of activity from 2006 to 2008 persists through 2010. From 1946 to the mid-1960s, as indicated by the arrow above, hurricane intensity was measured primarily by aircraft reconnaissance. Data prior to aircraft reconnaissance are not shown due to the greater uncertainty in estimates of a hurricane's maximum intensity. Satellites have increased the reliability of hurricane intensity estimates since the mid-1960s. Image Reference: NOAA20
The total number of hurricanes and strongest hurricanes (Category 4 and 5) observed from 1881 through 2008 shows multi-decade periods of above average activity in the 1800s, the mid-1900s, and since 1995. The power and frequency of Atlantic hurricanes have increased substantially in recent decades.14 There has been little change in the total number of landfalling hurricanes, in part because a variety of factors affect whether a hurricane will make landfall. These include large-scale steering winds, atmospheric stability, wind shear, and ocean heat content. This highlights the importance of understanding the broader changes occurring throughout the Atlantic Basin beyond the storms making landfall along the U.S. coast.14
Tropical storms and hurricanes develop and gain strength over warm ocean waters. As oceans warm, they provide a source of energy for hurricane growth. During the past 30 years, annual sea surface temperatures in the main Atlantic hurricane development region increased nearly 2°F. This warming coincided with an increase in the destructive energy (as defined by the Power Dissipation Index, a combination of intensity, duration, and frequency) of Atlantic tropical storms and hurricanes. The strongest hurricanes (Category 4 and 5) have, in particular, increased in intensity.14 The graph below shows the strong correlation between hurricane power and sea surface temperature in the Atlantic and the overall increase in both during the past 30 years. Climate models project that hurricane intensity will continue to increase, though at a lesser rate than that observed in recent decades.21
Observed Relationship Between Sea Surface Temperatures and Hurricane Power in the North Atlantic Ocean Observed sea surface temperature (blue) and the Power Dissipation Index (green), which combines frequency, intensity and duration for North Atlantic hurricanes.22 Hurricane rainfall and wind speeds are likely to increase in response to human-caused warming. Analyses of model simulations suggest that for each 1.8ºF increase in tropical sea surface temperatures, rainfall rates will increase by 6 to 18 percent.12 Image Reference: Emanuel22
New evidence has emerged recently for other temperature related linkages that can help explain the increase in Atlantic hurricane activity. This includes the contrast in sea surface temperature between the main hurricane development region and the broader tropical ocean.23,24,25 Other causes beyond the rise in ocean temperature, such as atmospheric stability and circulation, can also influence hurricane power. For these and other reasons, a confident assessment requires further study.12
Evidence of increasing hurricane strength in the Atlantic and other oceans with linkages to rising sea surface temperatures is also supported by satellite records dating back to 1981. An increase in the maximum wind speeds of the strongest hurricanes has been documented and linked to increasing sea surface temperatures.26
Observed and Projected Sea Surface Temperature Change: Atlantic Hurricane Formation Region Observed (black) and projected temperatures (blue = lower scenario; red = higher scenario) in the Atlantic hurricane formation region. Increased intensity of hurricanes is linked to rising sea surface temperatures in the region of the ocean where hurricanes form. The shaded areas show the likely ranges while the lines show the central projections from a set of climate models. Image Reference: CMIP3-A11
Projections are that sea surface temperatures in the main Atlantic hurricane development region will increase at even faster rates during the second half of this century under higher emissions scenarios. This highlights the need to better understand the relationship between increasing temperatures and hurricane intensity. As ocean temperatures continue to increase in the future, it is likelyat least two-thirds chance of occurring that hurricane rainfall and wind speeds will increase in response to human-caused warming.12 Analyses of model simulations suggest that for each 1.8°F increase in tropical sea surface temperatures, core rainfall rates will increase by 6 to 18 percent and the surface wind speeds of the strongest hurricanes will increase by about 1 to 8 percent.15 Even without further coastal development, storm surge levels and hurricane damages are likelyat least two-thirds chance of occurring to increase because of increasing hurricane intensity coupled with sea-level rise, the latter being a virtually certain outcome of the warming global climate.12
Pacific Tropical Storms
In the eastern Pacific, the strongest hurricanes have become stronger since the 1980s, even while the total number of storms has decreased.
Although on average more hurricanes form in the eastern Pacific than the Atlantic each year, cool ocean waters along the U.S. West Coast and atmospheric steering patterns help protect the contiguous U.S. from landfalls. Threats to the Hawaiian Islands are greater, but landfalling storms are rare in comparison to those of the U.S. East and Gulf Coasts. Nevertheless, changes in hurricane intensity and frequency could influence the impact of landfalling Pacific hurricanes in the future.
The total number of tropical storms and hurricanes in the eastern Pacific on seasonal to multi-decade time periods is generally opposite to that observed in the Atlantic. For example, during El Niño events it is common for hurricanes in the Atlantic to be suppressed while the eastern Pacific is more active. This reflects the large-scale atmospheric circulation patterns that extend across both the Atlantic and the Pacific oceans.27,28
Within the past three decades the total number of tropical storms and hurricanes and their destructive energy have decreased in the eastern Pacific.12,28 However, satellite observations have shown that like the Atlantic, the strongest hurricanes (the top 5 percent), have gotten stronger since the early 1980s.26,29 As ocean temperatures rise, the strongest hurricanes are likelyat least two-thirds chance of occurring to increase in both the eastern Pacific and the Atlantic.12
Sea Level
Sea level has risen along most of the U.S. coast over the past 50 years, and will rise more in the future.
Recent global sea-level rise has been caused by the warming-induced expansion of the oceans, accelerated melting of most of the world’s glaciers, and loss of ice on the Greenland and Antarctic ice sheets.30 There is strong evidence that global sea level is currently rising at an increased rate.30,31 A warming global climate will cause further sea-level rise over this century and beyond.4,32
Relative Sea-Level Changes on U.S. Coastlines, 1958 to 2008 Observed changes in relative sea level from 1958 to 2008 for locations on the U.S. coast. Some areas along the Atlantic and Gulf coasts saw increases greater than 8 inches over the past 50 years. Image Source: updated from Zervas33
During the past 50 years, sea level has risen up to 8 inches or more along some coastal areas of the United States, and has fallen in other locations. The amount of relative sea-level rise experienced along different parts of the U.S. coast depends on the changes in elevation of the land that occur as a result of subsidence (sinking) or uplift (rising), as well as increases in global sea level due to warming. In addition, atmospheric and oceanic circulation, which will be affected by climate change, will influence regional sea level. Regional differences in sea-level rise are also expected to be related to where the meltwater originates.34
Human-induced sea-level rise is occurring globally. Large parts of the Atlantic Coast and Gulf of Mexico Coast have experienced significantly higher rates of relative sea-level rise than the global average during the last 50 years, with the local differences mainly due to land subsidence.33 Portions of the Northwest and Alaska coast have, on the other hand, experienced slightly falling sea level as a result of long-term uplift as a consequence of glacier melting and other geological processes.
Regional variations in relative sea-level rise are expected in the future. For example, assuming historical geological forces continue, a 2-foot rise in global sea level (which is within the range of recent estimates) by the end of this century would result in a relative sea-level rise of 2.3 feet at New York City, 2.9 feet at Hampton Roads, Virginia, 3.5 feet at Galveston, Texas, and 1 foot at Neah Bay in Washington state.35
Snowstorms and Thunderstorms
Cold-season storm tracks are shifting northward and the strongest storms are likelyat least two-thirds chance of occurring to become stronger and more frequent.
Large-scale storm systems are the dominant weather phenomenon during the cold season in the United States. Although the analysis of these storms is complicated by a relatively short length of most observational records and by the highly variable nature of strong storms, some clear patterns have emerged.14
Storm tracks have shifted northward over the last 50 years as evidenced by a decrease in the frequency of storms in mid-latitude areas of the Northern Hemisphere, while high-latitude activity has increased. There is also evidence of an increase in the intensity of storms in both the mid- and high-latitude areas of the Northern Hemisphere, with greater confidence in the increases occurring in high latitudes.14 The northward shift is projected to continue, and strong cold season storms are likelyat least two-thirds chance of occurring to become stronger and more frequent, with greater wind speeds and more extreme wave heights.12
Snowstorms
The northward shift in storm tracks is reflected in regional changes in the frequency of snowstorms. The South and lower Midwest saw reduced snowstorm frequency during the last century. In contrast, the Northeast and upper Midwest saw increases in snowstorms, although considerable decade-to-decade variations were present in all regions, influenced, for example, by the frequency of El Niño events.14
 National: Lake-Effect Snow: Areas in New York state east of Lake Ontario received over 10 feet of lake-effect snow during a 10-day period in early February 2007.There is also evidence of an increase in lake-effect snowfall along and near the southern and eastern shores of the Great Lakes since 1950.10 Lake-effect snow is produced by the strong flow of cold air across large areas of relatively warmer ice-free water. As the climate has warmed, ice coverage on the Great Lakes has fallen. The maximum seasonal coverage of Great Lakes ice decreased at a rate of 8.4 percent per decade from 1973 through 2008, amounting to a roughly 30 percent decrease in ice coverage (see Midwest region). This has created conditions conducive to greater evaporation of moisture and thus heavier snowstorms. Among recent extreme lake-effect snow events was a February 2007 10-day storm total of over 10 feet of snow in western New York state. Climate models suggest that lake-effect snowfalls are likelyat least two-thirds chance of occurring to increase over the next few decades.36 In the longer term, lake-effect snows are likelyat least two-thirds chance of occurring to decrease as temperatures continue to rise, with the precipitation then falling as rain.37
Tornadoes and severe thunderstorms
Reports of severe weather including tornadoes and severe thunderstorms have increased during the past 50 years. However, the increase in the number of reports is widely believed to be due to improvements in monitoring technologies such as Doppler radars combined with changes in population and increasing public awareness. When adjusted to account for these factors, there is no clear trend in the frequency or strength of tornadoes since the 1950s for the United States as a whole.14
The distribution by intensity for the strongest 10 percent of hail and wind reports is little changed, providing no evidence of an observed increase in the severity of events.14 Climate models project future increases in the frequency of environmental conditions favorable to severe thunderstorms.38 But the inability to adequately model the small-scale conditions involved in thunderstorm development remains a limiting factor in projecting the future character of severe thunderstorms and other small-scale weather phenomena.12
Arctic Sea Ice
Arctic sea ice is declining rapidly and this is very likelyat least a 90% chance of occurring to continue.
Arctic Sea Ice Extent (Annual Average)") Observations of annual average Arctic sea ice extent for the period 1900 to 2008. The gray shading indicates less confidence in the data before 1953. Image References: Johannessen39; Fetterer et al.40Sea ice is a very important part of the climate system. In addition to direct impacts on coastal areas of Alaska, it more broadly affects surface reflectivity, ocean currents, cloudiness, humidity, and the exchange of heat and moisture at the ocean’s surface. Open ocean water is darker in color than sea ice, which causes it to absorb more of the Sun’s heat, which increases the warming of the water even more.17,41
Observations of annual average Arctic sea ice extent for the period 1900 to 2008. The gray shading indicates less confidence in the data before 1953. Image References: Johannessen39; Fetterer et al.40Sea ice is a very important part of the climate system. In addition to direct impacts on coastal areas of Alaska, it more broadly affects surface reflectivity, ocean currents, cloudiness, humidity, and the exchange of heat and moisture at the ocean’s surface. Open ocean water is darker in color than sea ice, which causes it to absorb more of the Sun’s heat, which increases the warming of the water even more.17,41
The most complete record of sea ice is provided by satellite observations of sea ice extent since the 1970s. Prior to that, aircraft, ship, and coastal observations in the Arctic make it possible to extend the record of Northern Hemisphere sea ice extent back to at least 1900, although there is a lower level of confidence in the data prior to 1953.17
Arctic Sea Ice Annual Minimum Arctic sea ice reaches its annual minimum in September. The satellite images above show September Arctic sea ice in 1979, the first year these data were available, and 2007. Image Reference: NASA/GSFC42Arctic sea ice extent has fallen at a rate of 3 to 4 percent per decade over the last three decades. End-of-summer Arctic sea ice has fallen at an even faster rate of more than 11 percent per decade in that time. The observed decline in Arctic sea ice has been more rapid than projected by climate models.43 Year-to-year changes in sea ice extent and record low amounts are influenced by natural variations in atmospheric pressure and wind patterns.44 However, clear linkages between rising greenhouse gas concentrations and declines in Arctic sea ice have been identified in the climate record as far back as the early 1990s.45 The extreme loss in Arctic sea ice that occurred in 2007 would not have been possible without the long-term reductions that have coincided with a sustained increase in the atmospheric concentration of carbon dioxide and the rapid rise in global temperatures that have occurred since the mid-1970s.39 Although the 2007 record low was not eclipsed in 2008, the 2008 sea ice extent is well below the long-term average, reflecting a continuation of the long-term decline in Arctic sea ice. In addition, the total volume of Arctic sea ice in 2008 was likely a record low because the ice was unusually thin.46
It is expected that declines in Arctic sea ice will continue in the coming decades with year-to-year fluctuations influenced by natural atmospheric variability. The overall rate of decline will be influenced mainly by the rate at which carbon dioxide and other greenhouse gas concentrations increase.47
U.S. Emission and Absorption of Heat-Trapping Gases
Annual CO2 Emissions in the U.S. U.S. annual emissions of CO2 from fossil-fuel use.48 Image Reference: Marland et al.48Since the industrial revolution, the United States has been the world’s largest emitter of heat-trapping gases. With 4.5 percent of world's population, the United States is responsible for about 28 percent of the human-induced heat-trapping gases in the atmosphere today.46 Although China has recently surpassed the United States in current total annual emissions, per capita emissions remain much higher in the United States. Carbon dioxide, the most important of the heat-trapping gases produced directly by human activities, is a cumulative problem because it has a long atmospheric lifetime. Roughly one-half of the carbon dioxide released from fossil fuel burning remains in the atmosphere after 100 years, and roughly one-fifth of it remains after 1,000 years.4
U.S. carbon dioxide emissions grew dramatically over the past century. These emissions come almost entirely from burning fossil fuels. These sources of carbon dioxide are one side of the equation and on the other side are “sinks” that take up carbon dioxide. The growth of trees and other plants is an important natural carbon sink. In recent years, it is estimated that about 20 percent of U.S. carbon dioxide emissions have been offset by U.S. forest growth and other sinks (see figure below).49 It is not known whether U.S. forests and other sinks will continue to take up roughly this amount of carbon dioxide in the future as climate change alters carbon release and uptake. For example, a warming-induced lengthening of the growing season would tend to increase carbon uptake. On the other hand, the increases in forest fires and in the decomposition rate of dead plant matter would decrease uptake, and might convert the carbon sink into a source.49
U.S. CO2 Emissions and Uptake U.S. carbon dioxide emissions and uptake in millions of tons of carbon per year in 2003. The bar marked “Emitted” indicates the amount of carbon as carbon dioxide added to the atmosphere from U.S. emissions. The bars marked “Absorbed” indicate amounts of carbon as carbon dioxide removed from the atmosphere. The thin lines on each bar indicate estimates of uncertainty. Image Source: modified from CCSP SAP 2.249The amount of carbon released and taken up by natural sources varies considerably from year to year depending on climatic and other conditions. For example, fires release carbon dioxide, so years with many large fires result in more carbon release and less uptake as natural sinks (the vegetation) are lost. Similarly, the trees destroyed by intense storms or droughts release carbon dioxide as they decompose, and the loss results in reduced strength of natural sinks until regrowth is well underway. For example, Hurricane Katrina killed or severely damaged over 320 million large trees. As these trees decompose over the next few years, they will release an amount of carbon dioxide equivalent to that taken up by all U.S. forests in a year.14 The net change in carbon storage in the long run will depend on how much is taken up by the regrowth as well as how much was released by the original disturbance.
Primary Sources
References
- 1. a. b. [72] Smith, T. M., R. W. Reynolds, T. C. Peterson, and J. Lawrimore. "Improvements to NOAA's Historical Merged Land-Ocean Surface Temperature Analysis (1880-2006)." Journal of Climate 21, no. 10 (2008): 2283-2296.
- 2. a. b. [107] various. footnote 107., 2009.
- 3. a. b. c. d. e. f. g. h. i. j. k. l. m. n. [91] various. footnote 91., 2009.
- 4. a. b. c. [90] Meehl, G. A., T. F. Stocker, W. D. Collins, P. Friedlingstein, A. T. Gaye, JM Gregory, A. Kitoh, R. Knutti, J. M. Murphy, A. Noda et al. "Global Climate Projections." In Climate Change 2007: The Physical Basis, edited by S. Solomon, D. Qin, M. Manning, Z. Chen, M. Marquis, K. B. Averyt, M. Tignor and H. L. Miller, 747-845. Vol. Contribution of Working Group I to the Fourth Assessment Report of the Intergovernmental Panel on Climate Change. Cambridge, UK and New York, NY: Cambridge University Press, 2007.
- 5. a. b. c. [108] Christensen, J. H., B. Hewitson, A. Busuioc, A. Chen, X. Gao, R. Held, R. Jones, R. K. Kolli, W. - T. Kwon, R. Laprise et al. "Regional climate projections." In Climate Change 2007: The Physical Science Basis, edited by S. Solomon, D. Qin, M. Manning, Z. Chen, M. Marquis, K. B. Averyt, M. Tignor and H. L. Miller, 847-940. Vol. Contribution of Working Group I to the Fourth Assessment Report of the Intergovernmental Panel on Climate Change. Cambridge UK and New York, NY: Cambridge University Press, 2007.
- 6. a. b. [109] various. footnote 109., 2009.
- 7. [110] various. footnote 110., 2009.
- 8. [25] Clarke, L., J. Edmonds, H. Jacoby, H. Pitcher, J. Reilly, and R. Richels. Scenarios of Greenhouse Gas Emissions and Atmospheric Concentrations. Vol. Sub-report 2.1A of Synthesis and Assessment Product 2.1. Washington, D.C.: U.S. Department of Energy, Office of Biological & Environmental Research, 2007.
- 9. a. b. [111] Center, NOAA's National Climatic Data. The USHCN Version 2 Serial Monthly Dataset., 2008.
- 10. a. b. c. [97] Cook, E. R., P. J. Bartlein, N. S. Diffenbaugh, R. Seager, B. N. Shuman, R. S. Webb, J. W. Williams, and CA Woodhouse. "Hydrological Variability and Change." In Abrupt Climate Change, 143-257. Vol. Synthesis and Assessment Product 3.4. Reston, VA: U.S. Geological Survey, 2008.
- 11. a. b. c. [93] various. footnote 93., 2009.
- 12. a. b. c. d. e. f. g. h. i. j. k. l. m. [68] Gutowski, W. J., G. C. Hegerl, G. J. Holland, T. R. Knutson, L. Mearns, R. J. Stouffer, P. J. Webster, M. F. Wehner, and F. W. Zwiers. "Causes of Observed Changes in Extremes and Projections of Future Changes." In Weather and Climate Extremes in a Changing Climate: Regions of Focus: North America, Hawaii, Caribbean, and U.S. Pacific Islands, edited by T. R. Karl, G. A. Meehl, C. D. Miller, S. J. Hassol, A. M. Waple and W. L. Murray, 81-116. Vol. Synthesis and Assessment Product 3.3. Washington, D.C.: U.S. Climate Change Science Program, 2008.
- 13. [113] Groisman, P.Ya., R. W. Knight, T. R. Karl, D. R. Easterling, B. Sun, and J. H. Lawrimore. "Contemporary Changes of the Hydrological Cycle over the Contiguous United States: Trends Derived from In Situ Observations." Journal of Hydrometeorology 5, no. 1 (2004): 64-85.
- 14. a. b. c. d. e. f. g. h. i. j. k. l. m. n. o. p. [112] Kunkel, K., P. D. Bromirski, H. E. Brooks, T. Cavazos, A. V. Douglas, D. R. Easterling, K. Emanuel, P.Ya. Groisman, G. J. Holland, T. R. Knutson et al. "Observed Changes in Weather and Climate Extremes." In Weather and Climate Extremes in a Changing Climate: Regions of Focus: North America, Hawaii, Caribbean, and U.S. Pacific Islands, edited by T. R. Karl, G. A. Meehl, C. D. Miller, S. J. Hassol, A. M. Waple and W. L. Murray, 35-80. Vol. CCSP Synthesis and Assessment Product 3.3. Washington, D.C.: U.S. Climate Change Science Program, 2008.
- 15. a. b. [114] Karl, T. R., G. A. Meehl, T. C. Peterson, K. E. Kunkel, W. J. Gutowski, and D. R. Easterling. "Executive Summary." In Weather and Climate Extremes in a Changing Climate - Region of Focus: North America, Hawaii, Caribbean, and Pacific Islands, edited by T. R. Karl, G. A. Meehl, C. D. Miller, S. J. Hassol, A. M. Waple and W. L. Murray, 1-9. Vol. Synthesis and Assessment Product 3.3. Washington, D.C.: U.S. Climate Change Science Program, 2008.
- 16. [116] USGS. Changes in Streamflow Timing in the Western United States in Recent Decades In USGS Fact Sheet 2005 - 3018. Reston, VA: U.S. Geological Survey, 2005.
- 17. a. b. c. [40] Lemke, P., J. Ren, R. B. Alley, I. Allison, J. Carrasco, G. Flato, Y. Fujii, G. Kaser, P. Mote, R. H. Thomas et al. "Observations: Changes in Snow, Ice, and Frozen Ground." In Climate Change 2007: The Physical Basis - Contribution of Working Group I to the Fourth Assessment Report of the Intergovernmental Panel on Climate Change, edited by S. Solomon, D. Qin, M. Manning, Z. Chen, M. Marquis, K. B. Averyt, M. Tignor and H. L. Miller, 337-383. Cambridge University Press, 2007.
- 18. [117] various. footnote 117., 2009.
- 19. [115] Seager, R., M. Ting, I. Held, Y. Kushnir, J. Lu, G. Vecchi, H. - P. Huang, N. Harnik, A. Leetmaa, N. - C. Lau et al. "Model Projections of an Imminent Transition to a More Arid Climate in Southwestern North America." Science 316, no. 5828 (2007): 1181-1184.
- 20. a. b. [121] various. footnote 121., 2009.
- 21. [100] Emanuel, K., R. Sundararajan, and J. Williams. "Hurricanes and Global Warming - Results from Downscaling IPCC AR4 Simulations." Bulletin of the American Meteorological Society 89, no. 3 (2008): 347-367.
- 22. a. b. [120] Emanuel, K.. "Environmental Factors Affecting Tropical Cyclone Power Dissipation." Journal of Climate 20, no. 22 (2007): 5497-5509.
- 23. [99] Vecchi, G. A., K. L. Swanson, and B. J. Soden. "Whither Hurricane Activity?" Science 322, no. 5902 (2008): 687-689.
- 24. [118] Swanson, K. L.. "Nonlocality of Atlantic Tropical Cyclone Intensities." Geochemistry, Geophysics, Geosystems 9 (2008).
- 25. [119] Knutson, T. R., J. J. Sirutis, S. T. Garner, G. A. Vecchi, and I. M. Held. "Simulated Reduction in Atlantic Hurricane Frequency under Twenty-first-century Warming Conditions." Nature Geoscience 1, no. 6 (2008): 359-364.
- 26. a. b. [122] Elsner, J. B., J. P. Kossin, and T. H. Jagger. "The Increasing Intensity of the Strongest Tropical Cyclones." Nature 455, no. 7209 (2008): 92-95.
- 27. [123] Bell, G. D., and M. Chelliah. "Leading Tropical Modes Associated with Interannual and Multidecadal Fluctuations in North Atlantic Hurricane Activity." Journal of Climate 19, no. 4 (2006): 590-612.
- 28. a. b. [124] State of the Climate in 2007 In Bulletin of the American Meteorological Society, Edited by D. H. Levinson and J. H. Lawrimore. Vol. 89. Boston, MA: American Meteorological Society, 2008.
- 29. [125] Kossin, J. P., K. R. Knapp, D. J. Vimont, R. J. Murnane, and B. A. Harper. "A Globally Consistent Reanalysis of Hurricane Variability and Trends." Geophysical Research Letters 34 (2007): -.
- 30. a. b. [37] Bindoff, N. L., J. Willebrand, V. Artale, A. Cazenave, JM Gregory, S. Gulev, K. Hanawa, C. Le Quere, S. Levitus, Y. Nojiri et al. "Observations: Oceanic Climate Change and Sea Level." In Climate Change 2007: The Physical Science Basis, edited by S. Solomon, D. Qin, M. Manning, Z. Chen, M. Marquis, K. B. Averyt, M. Tignor and H. L. Miller, 385-432. Vol. Contribution of Working Group I to the Fourth Assessment Report of the Intergovernmental Panel on Climate Change. Cambridge, UK and New York, NY: Cambridge Unversity Press, 2007.
- 31. [126] Rahmstorf, S., A. Cazenave, J. A. Church, J. E. Hansen, R. F. Keeling, D. E. Parker, and R. C. J. Somerville. "Recent Climate Observations Compared to Projections." Science 316, no. 5825 (2007): 709.
- 32. [105] Clark, P. U., A. J. Weaver, E. Brook, E. R. Cook, T. L. Delworth, and K. Steffen. "Introduction: Abrupt Changes in the Earth's Climate System." In Abrupt Climate Change, 19-59. Vol. Synthesis and Assessment Product 3.4. Reston, VA: U.S. Geological Survey, 2008.
- 33. a. b. [127] Zervas, C.. Sea Level Variations of the United States 1985 - 1999 In NOAA Technical Report NOS CO-OPS 36. Silver Spring, MD: National Oceanic and Atmospheric Administration, 2001.
- 34. [104] Mitrovica, J. X., N. Gomez, and P. U. Clark. "The Sea-Level Fingerprint of West Antarctic Collapse." Science 323, no. 5915 (2009): 753.
- 35. [128] various. footnote 128., 2009.
- 36. [130] Burnett, A. W., M. E. Kirby, H. T. Mullins, and W. P. Patterson. "Increasing Great Lake-effect snowfall during the twentieth century: A regional response to global warming?" Journal of Climate 16, no. 21 (2003): 3535-3542.
- 37. [129] Kunkel, K. E., N. E. Westcott, and D. A. R. Kristovich. "Assessment of Potential Effects of Climate Change on Heavy Lake-effect Snowstorms Near Lake Erie." Journal of Great Lakes Research 28, no. 4 (2002): 521-536.
- 38. [131] Trapp, R. J., N. S. Diffenbaugh, H. E. Brooks, M. E. Baldwin, E. D. Robinson, and J. S. Pal. "Changes in Severe Thunderstorm Environment Frequency During the 21st Century Caused by Anthropogenically Enhanced Global Radiative Forcing." Proceedings of the National Academy of Sciences of the United States of America 104, no. 50 (2007): 19719-19723.
- 39. a. b. [135] Johannessen, O. M.. "Decreasing Arctic Sea Ice Mirrors Increasing CO2 on Decadal Time Scale." Atmospheric and Oceanic Science Letters 1, no. 1 (2008): 51-56.
- 40. [139] Fetterer, F., K. Knowles, W. Meier, and M. Savoie. Sea Ice Index - National Snow and Ice Data Center. Boulder, CO, 2002.
- 41. [132] ACIA. Arctic Climate Impact Assessment. Cambridge, UK and New York, NY: Cambridge University Press, 2005.
- 42. [138] various. footnote 138., 2009.
- 43. [133] Stroeve, J., M. M. Holland, W. Meier, T. Scambos, and M. Serreze. "Arctic Sea Ice Decline: Faster than Forecast." Geophysical Research Letters 34 (2007): -.
- 44. [134] L'Heureux, M. L., A. Kumar, G. D. Bell, M. S. Halpert, and R. W. Higgins. "Role of the Pacific-North American (PNA) Pattern in the 2007 Arctic Sea Ice Decline." Geophysical Research Letters 134 (2008): -.
- 45. [61] Min, S. K., X. B. Zhang, F. W. Zwiers, and T. Agnew. "Human Influence on Arctic Sea Ice Detectable from Early 1990s Onwards." Geophysical Research Letters 35 (2008): -.
- 46. a. b. [136] and Center, National Snow Ice Data. Arctic Sea Ice Down to Second-lowest Extent; Likely Record-low Volume., 2008.
- 47. [137] Polyak, L., J. Andrews, J. Brigham-Grette, D. Darby, A. Dyke, S. Funder, M. Holland, A. Jennings, J. Savelle, M. Serreze et al. "History of Sea Ice in the Arctic." In Past Climate Variability and Change in the Arctic and at High Latitude, 358-420. Vol. Synthesis and Assessment Product 1.2. Reston, VA: U.S. Geological Survey, 2009.
- 48. a. b. [141] Marland, G., R. J. Andres, T. J. Blasing, T. A. Boden, C. T. Broniak, J. S. Gregg, L. M. Losey, and K. Treanton. "Energy, Industry, and Waste Management Activities: An Introduction to CO2 Emissions From Fossil Fuels." In The First State of the Carbon Cycle Report (SOCCR): The North American Carbon Budget and Implications for the Global Carbon Cycle, edited by A. W. King, L. Dilling, G. P. Zimmerman, D. M. Fairman, RA Houghton, G. Marland, A. Z. Rose and T. J. Wilbanks, 57-64. Vol. Synthesis and Assessment Product 2.2. Asheville, NC: NOAA's National Climatic Data Center, 2007.
- 49. a. b. c. [140] Pacala, S., R. Birdsey, S. Bridgham, R. T. Conant, K. Davis, B. Hales, RA Houghton, J. C. Jenkins, M. Johnston, G. Marland et al. "The North American Carbon Budget Past and Present." In The First State of the Carbon Cycle Report (SOCCR): The North American Carbon Budget and Implications for the Global Carbon Cycle, edited by A. W. King, L. Dilling, G. P. Zimmerman, D. M. Fairman, RA Houghton, G. Marland, A. Z. Rose and T. J. Wilbanks, 29-36. Vol. Synthesis and Assessment Product 2.2. Asheville, NC: NOAA's National Climatic Data Center, 2007.