The content of this website is no longer being updated. For information on current assessment activities, please visit http://www.globalchange.gov/what-we-do/assessment
Energy Supply and Use
Key Messages:
- Warming will be accompanied by deceases in demand for heating energy and inceases in demand for cooling energy. The latter will result in significant increases in electricity use and higher peak demand in most regions.
- Energy production is likely to be constrained by rising temperatures and limited water supplies in many regions.
- Energy production and delivery systmes are exposed to sea-level rise and extreme weather events in vulnerable regions.
- Climate change is likely to affect some renewable energy sources across the nation, such as hydropower production in regions subject to changing patterns of precipitation or snowmelt.
Sources of US Greenhouse Emissions (2003)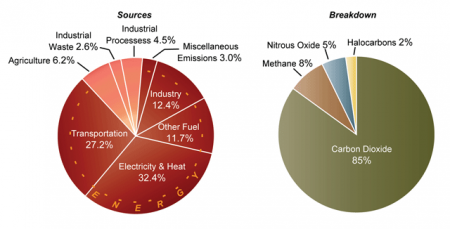 About 87 percent of U.S. greenhouse gas emissions come from energy production and use, as shown in the left pie chart. The right pie chart breaks down these emissions by greenhouse gas. Image Reference: adapted from U.S. EPA1Energy is at the heart of the global warming challenge.2 It is humanity’s production and use of energy that is the primary cause of global warming, and in turn, climate change will eventually affect our production and use of energy. The vast majority of U.S. greenhouse gas emissions, about 87 percent, come from energy production and use.3
At the same time, other U.S. trends are increasing energy use: population shifts to the South, especially the Southwest, where air conditioning use is high, an increase in the square footage built per person, increased electrification of the residential and commercial sectors, and increased market penetration of air conditioning.4
Primary Energy Consumption by Major Source (1949 to 2007)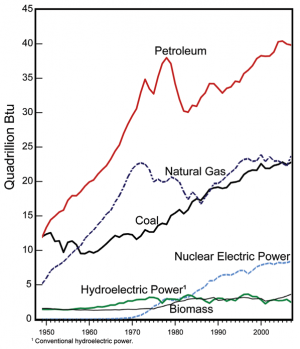 U.S. energy supply is dominated by fossil fuels. Petroleum, the top source of energy shown above, is primarily used for transportation (70 percent of oil use). Natural gas is used in roughly equal parts to generate electricity, power industrial processes, and heat water and buildings. Coal is primarily used to generate electricity (91 percent of coal use). Nuclear power is used entirely for electricity generation. Image Reference: EIA5
Many of the effects of climate change on energy production and use in the United States are not well studied. Some of the effects of climate change, however, have clear implications for energy production and use. For instance, rising temperatures are expected to increase energy requirements for cooling and reduce energy requirements for heating.6,4 Changes in precipitation have the potential to affect prospects for hydropower, positively or negatively.4 Increases in hurricane intensity are likely to cause further disruptions to oil and gas operations in the Gulf, like those experienced in 2005 with Hurricane Katrina and in 2008 with Hurricane Ike.4 Concerns about climate change impacts will almost certainly alter perceptions and valuations of energy technology alternatives. These effects are very likely to be relevant for energy policies, decisions, and institutions in the United States, affecting courses of action and appropriate strategies for risk management.4
US Electricity Sources (2007)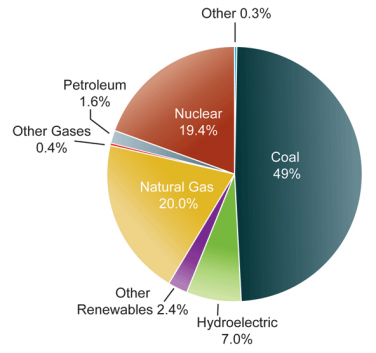 Coal, natural gas, and nuclear power plants together account for about 90 percent of current U.S. electricity production. Image Reference: EIA5The overall scale of the national energy economy is very large, and the energy industry has both the financial and the managerial resources to be adaptive. Impacts due to climate change are likely to be most apparent at sub-national scales, such as regional effects of extreme weather events and reduced water availability, and effects of increased cooling demands on especially vulnerable places and populations.7
Energy Demand
Warming will be accompanied by decreases in demand for heating energy and increases in demand for cooling energy. The latter will result in significant increases in electricity use and higher peak demand in most regions.
Change in Population from 1970 to 2008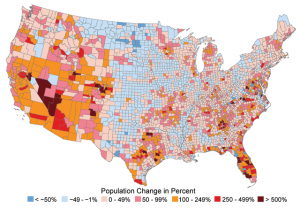 The map above, showing percentage changes in county population between 1970 and 2008, graphically illustrates the large increases in places that require air conditioning. Areas with very large increases are shown in orange, red, and maroon. Some places had enormous growth, in the hundreds of thousands of people. For example, counties in the vicinity of South Florida, Atlanta, Los Angeles, Phoenix, Las Vegas, Denver, Dallas, and Houston all had very large increases. Image Reference: U.S. Census8
Research on the effects of climate change on energy production and use has largely been limited to impacts on energy use in buildings. These studies have considered effects of global warming on energy requirements for heating and cooling in buildings in the United States.9 They find that the demand for cooling energy increases from 5 to 20 percent per 1.8°F of warming, and the demand for heating energy drops by 3 to 15 percent per 1.8°F of warming.9 These ranges reflect different assumptions about factors such as the rate of market penetration of improved building equipment technologies.9
Studies project that temperature increases due to global warming are very likelyat least a 90% chance of occurring to increase peak demand for electricity in most regions of the country.9 An increase in peak demand can lead to a disproportionate increase in energy infrastructure investment.9
Shifting Energy Demand in the United States by 2080-2099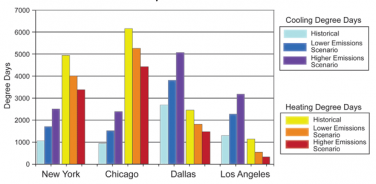 “Degree days” are a way of measuring the energy needed for heating and cooling by adding up how many degrees hotter or colder each day’s average temperature is from 65ºF over the course of a year. Colder locations have high numbers of heating degree days and low numbers of cooling degree days, while hotter locations have high numbers of cooling degree days and low numbers of heating degree days. Nationally, the demand for energy will increase in summer and decrease in winter. Cooling uses electricity while heating uses a combination of energy sources, so the overall effect nationally and in most regions will be an increased need for electricity. The projections shown in the chart are for late this century. The higher emissions scenario10 used here is referred to as “even higher” in figure from Global Climate Change section. Image Reference: CMIP3-B11Since nearly all of the cooling of buildings is provided by electricity use, whereas the vast majority of the heating of buildings is provided by natural gas and fuel oil,4,12 the projected changes imply increased demands for electricity. This is especially the case where climate change would result in significant increases in the heat index in summer, and where relatively little space cooling has been needed in the past, but demands are likelyat least two-thirds chance of occurring to increase in the future.9 The increase in electricity demand is likelyat least two-thirds chance of occurring to be accelerated by population movements to the South and Southwest, which are regions of especially high per capita electricity use, due to demands for cooling in commercial buildings and households.9 Because nearly half of the nation’s electricity is currently generated from coal, these factors have the potential to increase total national carbon dioxide emissions in the absence of improved energy efficiency, development of non-carbon energy sources, and/or carbon capture and storage.9
Other effects of climate change on energy consumption are less clear, because little research has been done.9 For instance, in addition to cooling, air conditioners also remove moisture from the air; thus the increase in humidity projected to accompany global warming is likelyat least two-thirds chance of occurring to increase electricity consumption by air conditioners even further.9 As other examples, warming would increase the use of air conditioners in highway vehicles, and water scarcity in some regions has the potential to increase energy demands for water pumping. It is important to improve the information available about these other kinds of effects.
Energy and Water Connections
Energy production is likely to be constrained by rising temperatures and limited water supplies in many regions.
In some regions, reductions in water supply due to decreases in precipitation and/or water from melting snowpack are likelyat least two-thirds chance of occurring to be significant, increasing the competition for water among various sectors including energy production (see Water Resources sector).13,14
The production of energy from fossil fuels (coal, oil, and natural gas) is inextricably linked to the availability of adequate and sustainable supplies of water.13,14 While providing the United States with the majority of its annual energy needs, fossil fuels also place a high demand on the nation’s water resources in terms of both quantity and quality impacts.13,14 Generation of electricity in thermal power plants (coal, nuclear, gas, or oil) is water intensive. Power plants rank only slightly behind irrigation in terms of freshwater withdrawals in the United States.13
There is a high likelihood that water shortages will limit power plant electricity production in many regions. Future water constraints on electricity production in thermal power plants are projected for Arizona, Utah, Texas, Louisiana, Georgia, Alabama, Florida, California, Oregon, and Washington state by 2025.13 Additional parts of the United States could face similar constraints as a result of drought, growing populations, and increasing demand for water for various uses, at least seasonally.15 Situations where the development of new power plants is being slowed down or halted due to inadequate cooling water are becoming more frequent throughout the nation.13
The issue of competition among various water uses is dealt with in more detail in the Water Resources sector. In connection with these issues and other regional water scarcity impacts, energy is likely to be needed to move and manage water. This is one of many examples of interactions among the impacts of climate change on various sectors that, in this case, affects energy requirements.
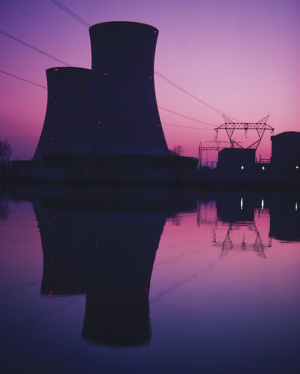 Nuclear, coal, and natural gas power plants require large amounts of water for cooling.13In addition to the problem of water availability, there are issues related to an increase in water temperature. Use of warmer water reduces the efficiency of thermal power plant cooling technologies. And, warmer water discharged from power plants can alter species composition in aquatic ecosystems.16 Large coal and nuclear plants have been limited in their operations by reduced river levels caused by higher temperatures and thermal limits on water discharge.13
The efficiency of thermal power plants, fossil or nuclear, is sensitive to ambient air and water temperatures; higher temperatures reduce power outputs by affecting the efficiency of cooling.13 Although this effect is not large in percentage terms, even a relatively small change could have significant implications for total national electric power supply.13 For example, an average reduction of 1 percent in electricity generated by thermal power plants nationwide would mean a loss of 25 billion kilowatt-hours per year,17 about the amount of electricity consumed by 2 million Americans, a loss that would need to be supplied in some other way or offset through measures that improve energy efficiency.
Climate Stress on Energy Systems
Energy production and delivery systems are exposed to sea-level rise and extreme weather events in vulnerable regions.
Sea-level rise
A significant fraction of America’s energy infrastructure is located near the coasts, from power plants, to oil refineries, to facilities that receive oil and gas deliveries.13 Rising sea levels are likelyat least two-thirds chance of occurring to lead to direct losses, such as equipment damage from flooding or erosion, and indirect effects, such as the costs of raising vulnerable assets to higher levels or building new facilities farther inland, increasing transportation costs.13 The U.S. East Coast and Gulf Coast have been identified as particularly vulnerable to sea-level rise because the land is relatively flat and also sinking in many places.13
Extreme events
Observed and projected increases in a variety of extreme events will have significant impacts on the energy sector. As witnessed in 2005, hurricanes can have a debilitating impact on energy infrastructure. Direct losses to the energy industry in 2005 are estimated at $15 billion,13 with millions more in restoration and recovery costs. As one example, the Yscloskey Gas Processing Plant (located on the Louisiana coast) was forced to close for six months following Hurricane Katrina, resulting in lost revenues to the plant’s owners and employees, and higher prices to consumers, as gas had to be procured from other sources.13
The impacts of an increase in severe weather are not limited to hurricane-prone areas. For example, rail transportation lines, which carry approximately two-thirds of the coal to the nation’s power plants,18 often follow riverbeds, especially in the Appalachian region.13 More intense rainstorms, which have been observed and projected,19,20 can lead to rivers flooding, which can “wash out” or degrade nearby railbeds and roadbeds.13 This is also a problem in the Midwest, which experienced major flooding of the Mississippi River in 1993 and 2008.21
Development of new energy facilities could be restricted by siting concerns related to sea-level rise, exposure to extreme events, and increased capital costs resulting from a need to provide greater protection from extreme events.13 The electricity grid is also vulnerable to climate change effects, from temperature changes to severe weather events.13 The most familiar example is effects of severe weather events on power lines, such as from ice storms, thunderstorms, and hurricanes. In the summer heat wave of 2006, for example, electric power transformers failed in several areas (including St. Louis, Missouri, and Queens, New York) due to high temperatures, causing interruptions of electric power supply. It is not yet possible to project effects of climate change on the grid, because so many of the effects would be more localized than current climate change models can depict; but, weather-related grid disturbances are recognized as a challenge for strategic planning and risk management.
Significant Weather-Related U.S Electric Grid Disturbances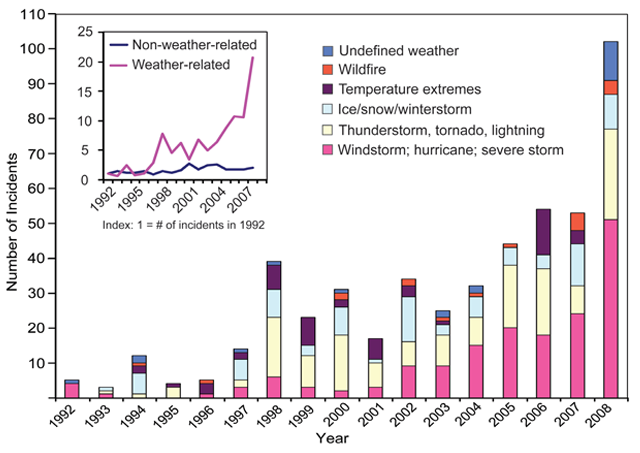 The number of incidents caused by extreme weather has increased tenfold since 1992. The portion of all events that are caused by weather-related phenomena has more than tripled from about 20 percent in the early 1990s to about 65 percent in recent years. The weather-related events are more severe, with an average of about 180,000 customers affected per event compared to about 100,000 for non-weather-related events (and 50,000 excluding the massive blackout of August 2003).4 The data shown include disturbances that occurred on the nation’s large-scale “bulk” electric transmission systems. Most outages occur in local distribution networks and are not included in the graph. Although the figure does not demonstrate a cause-effect relationship between climate change and grid disruption, it does suggest that weather and climate extremes often have important effects on grid disruptions. We do know that more frequent weather and climate extremes are likely in the future,19 which poses unknown new risks for the electric grid. Image Reference: EIA22
Regional Spotlight: Gulf Coast Oil and Gas
The Gulf Coast is home to the U.S. oil and gas industries, representing nearly 30 percent of the nation’s crude oil production and approximately 20 percent of its natural gas production. One-third of the national refining and processing capacity lies on coastal plains adjacent to the Gulf of Mexico. Several thousand offshore drilling platforms, dozens of refineries, and thousands of miles of pipelines are vulnerable to damage and disruption due to sea-level rise and the high winds and storm surge associated with hurricanes and other tropical storms. For example, hurricanes Katrina and Rita halted all oil and gas production from the Gulf, disrupted nearly 20 percent of the nation’s refinery capacity, and closed many oil and gas pipelines.23 Relative sea-level rise in parts of the Gulf Coast region (Louisiana and East Texas) is projected to be as high as 2 to 4 feet by 2050 to 2100, due to the combination of global sea-level rise caused by warming oceans and melting ice and local land sinking.24 Combined with onshore and offshore storm activity, this would represent an increased threat to this regional energy infrastructure. Some adaptations to these risks are beginning to emerge (see Adaptation box below).
Offshore oil production is particularly susceptible to extreme weather events. Hurricane Ivan in 2004 destroyed seven platforms in the Gulf of Mexico, significantly damaged 24 platforms, and damaged 102 pipelines. Hurricanes Katrina and Rita in 2005 destroyed more than 100 platforms and damaged 558 pipelines. For example, Chevron’s $250 million “Typhoon” platform was damaged beyond repair. Plans are being made to sink its remains to the seafloor.
Adaptation: Addressing Oil Infrastructure Vulnerabilities in the Gulf Coast
 Port Fourchon, Louisiana, supports 75 percent of deepwater oil and gas production in the Gulf of Mexico, and its role in supporting oil production in the region is increasing. The Louisiana Offshore Oil Port, located about 20 miles offshore, links daily imports of 1 million barrels of oil and production of 300,000 barrels in the Gulf of Mexico to 50 percent of national refining capacity. One road, Louisiana Highway 1, connects Port Fourchon with the nation. It transports machinery, supplies, and workers and is the evacuation route for onshore and offshore workers. Responding to threats of storm surge and flooding, related in part to concerns about climate change, Louisiana is currently upgrading Highway 1, including elevating it above the 500-year flood level and building a higher bridge over Bayou LaFourche and the Boudreaux Canal.25
Regional Spotlight: Florida’s Energy Infrastructure
 Florida’s energy infrastructure is particularly vulnerable to sea-level rise and storm impacts. Most of the petroleum products consumed in Florida are delivered by barge to three ports, two on the east coast and one on the west coast. The interdependencies of natural gas distribution, transportation fuel distribution and delivery, and electrical generation and distribution were found to be major issues in Florida’s recovery from recent major hurricanes.13
Renewable Energy Sources
Climate change is likely to affect some renewable energy sources across the nation, such as hydropower production in regions subject to changing patterns of precipitation or snowmelt.
Renewable sources currently account for about 9 percent of electricity production in the United States.5 Hydroelectric power is by far the largest renewable contributor to electricity generation,13 accounting for about 7 percent of total U.S. electricity.26 Like many things discussed in this report, renewable energy resources have strong interrelationships with climate change; using renewable energy can reduce the magnitude of climate change, while climate change can affect the prospects for using some renewable energy sources.
Hydropower is a major source of electricity in some regions of the United States, notably in the Northwest.13 It is likely to be significantly affected by climate change in regions subject to reduced precipitation and/or water from melting snowpack. Significant changes are already being detected in the timing and amount of streamflows in many western rivers,6 consistent with the predicted effects of global warming. More precipitation coming as rain rather than snow, reduced snowpack, earlier peak runoff, and related effects are beginning to affect hydropower availability.6
Hydroelectric generation is very sensitive to changes in precipitation and river discharge. For example, every 1 percent decrease in precipitation results in a 2 to 3 percent drop in streamflow;27 every 1 percent decrease in streamflow in the Colorado River Basin results in a 3 percent drop in power generation.13 Such magnifying sensitivities occur because water flows through multiple power plants in a river basin.13
Climate impacts on hydropower occur when either the total amount or the timing of runoff is altered, such as when natural water storage in snowpack and glaciers is reduced under hotter conditions. Glaciers, snowpack, and their associated runoff are already declining in the West, and larger declines are projected.6
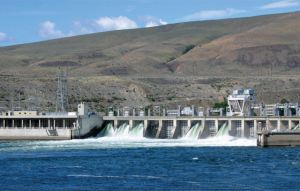 Hydroelectric dam in the Northwest
Hydropower operations are also affected by changes to air temperatures, humidity, or wind patterns due to climate change.13 These variables cause changes in water quantity and quality, including water temperature. Warmer air and water generally increase the evaporation of water from the surface of reservoirs, reducing the amount of water available for power production and other uses. Huge reservoirs with large surface areas, located in arid, sunny parts of the country, such as Lake Mead (located on Arizona-Nevada border on the Colorado River), are particularly susceptible to increased evaporation due to warming, meaning less water will be available for all uses, including hydropower.13 And, where hydropower dams flow into waterways that support trout, salmon or other coldwater fisheries, warming of reservoir releases might have detrimental consequences that require changes in operations that reduce power production.13 Such impacts will increasingly translate into competition for water resources.
Climate change is also likely to affect other renewable energy sources. For example, changing cloud cover affects solar energy resources, changes in winds affect wind power, and temperature and water availability affect biomass production (particularly related to water requirements for biofuels).13 The limited research to date on these important issues does not support firm conclusions about where such impacts would occur and how significant they would be.9 This is an area that calls for much more study (see An Agenda for Climate Impacts Science section, Recommendation 2).
Regional Spotlight: Energy Impacts of Alaska’s Rapid Warming
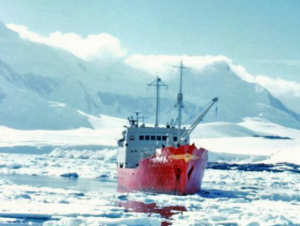 Significant impacts of warming on the energy sector can already be observed in Alaska, where temperatures have risen about twice as much as the rest of the nation. In Alaska, frozen ground and ice roads are an important means of winter travel, and warming has resulted in a much shorter cold season. Impacts on the oil and natural gas industries on Alaska’s North Slope have been one of the results. For example, the season during which oil and gas exploration and extraction equipment can be operated on the tundra has been shortened due to warming. In addition, the thawing of permafrost, on which buildings, pipelines, airfields, and coastal installations supporting oil and gas development are located, adversely affects these structures and increases the cost of maintaining them.13
Different energy impacts are expected in the marine environment as sea ice continues to retreat and thin. These trends are expected to improve shipping accessibility, including oil and gas transport by sea, around the margins of the Arctic Basin, at least in the summer. The improved accessibility, however, will not be uniform throughout the different regions. Offshore oil exploration and extraction might benefit from less extensive and thinner sea ice, although equipment will have to be designed to withstand increased wave forces and ice movement.13,28
Primary Sources
References
- 1. [202] various. footnote 202., 2009.
- 2. [3] Forster, P., V. Ramaswamy, P. Artaxo, T. Berntsen, R. A. Betts, D. W. Fahey, J. Haywood, J. Lean, D. C. Lowe, G. Myhre et al. "Changes in Atmospheric Constituents and in Radiative Forcing." In Climate Change 2007: The Physical Basis, edited by S. Solomon, D. Qin, M. Manning, Z. Chen, M. Marquis, K. B. Averyt, M. Tignor and H. L. Miller, 129-234. Vol. Contribution of Working Group I to the Fourth Assessment Report of the Intergovernmental Panel on Climate Change. Cambridge, UK and New York, NY: Cambridge University Press, 2007.
- 3. [200] Administration, Energy Information U. S.. Energy in Brief: What are Greenhouse Gases and How Much are Emitted by the United States?. Washington, D.C.: U.S. Energy Information Administration, 2008.
- 4. a. b. c. d. e. f. g. [201] Wilbanks, T. J., and al.et. "Executive Summary." In Effects of Climate Change on Energy Production and Use in the United States, edited by T. J. Wilbanks, V. Bhatt, D. E. Bilello, S. R. Bull, J. Ekmann, W. C. Horak, Y. J. Huang, M. D. Levine, M. J. Sale, D. K. Schmalzer et al., x-xii. Vol. Synthesis and Assessment Product 4.5. Washington, D.C.: U.S. Climate Change Science Program, 2007.
- 5. a. b. c. [203] Administration, Energy Information U. S.. Annual Energy Review 2007. Washington, D.C.: U.S. Department of Energy, 2008.
- 6. a. b. c. d. [164] Field, C., L. D. Mortsch, M. Brklacich, D. L. Forbes, P. Kovacs, J. A. Patz, S. W. Running, and M. J. Scott. "North America." In Climate Change 2007: Impacts Adaptation and Vulnerabiltiy, edited by M. L. Parry, O. F. Canziani, J. P. Palutikof, P. J. van der Linden and C. E. Hanson, 617-652. Vol. Contribution of Working Group II to the Fourth Assessment Report of the Intergovernmental Panel on Climate Change. Cambridge, UK and New York, NY: Cambridge University Press, 2007.
- 7. [204] Bhatt, V., J. Eckmann, W. C. Horak, and T. J. Wilbanks. "Possible Indirect Effects on Energy Production and Distribution in the United States." In Effects of Climate Change on Energy Production and Use in the United States, edited by T. J. Wilbanks, V. Bhatt, D. E. Bilello, S. R. Bull, J. Ekmann, W. C. Horak, Y. J. Huang, M. D. Levine, M. J. Sale, D. K. Schmalzer et al., 81-97. Vol. Synthesis and Assessment Product 4.5. Washington, D.C.: U.S. Climate Change Science Program, 2007.
- 8. [207] Bureau, Census U. S.. Population of States and Counties of the United States: 1790-2000. Washington, D.C.: U.S. Census Bureau, 2002.
- 9. a. b. c. d. e. f. g. h. i. j. k. [205] Scott, M. J., and Y. J. Huang. "Effects of Climate Change on Energy Use in the United States." In Effects of Climate Change on Energy Production and Use in the United States, edited by T. J. Wilbanks, V. Bhatt, D. E. Bilello, S. R. Bull, J. Ekmann, W. C. Horak, Y. J. Huang, M. D. Levine, M. J. Sale, D. K. Schmalzer et al., 8-44. Vol. Synthesis and Assessment Product 4.5. Washington, D.C.: U.S. Climate Change Science Program, 2007.
- 10. [91] various. footnote 91., 2009.
- 11. [117] various. footnote 117., 2009.
- 12. [206] of Energy, Department U. S.. Buildings Energy Data Book. Washington, D.C.: U.S. Department of Energy, Office of Energy Efficiency and Renewable Energy, 2008.
- 13. a. b. c. d. e. f. g. h. i. j. k. l. m. n. o. p. q. r. s. t. u. v. w. x. y. z. . . . . [191] Bull, S. R., D. E. Bilello, J. Ekmann, M. J. Sale, and D. K. Schmalzer. "Effects of Climate Change on Energy Production and Distribution in the United States." In Effects of Climate Change on Energy Production and Use in the United States, edited by T. J. Wilbanks, V. Bhatt, D. E. Bilello, S. R. Bull, J. Ekmann, W. C. Horak, Y. J. Huang, M. D. Levine, M. J. Sale, D. K. Schmalzer et al., 45-80. Vol. Synthesis and Assessment Product 4.5. Washington, D.C.: U.S. Climate Change Science Program, 2007.
- 14. a. b. c. [208] Feldman, D. L., K. L. Jacobs, G. Garfin, A. Georgakakos, B. Morehouse, R. S. Webb, B. Yarnal, J. Kochendorfer, C. Rosenzweig, M. J. Sale et al. "Decision-Support Experiments Within the Water Resource Management Sector." In Decision-support Experiments and Evaluations Using Seasonal-to-Interannual Forecast and Observational Data: A Focus on Water Resources, edited by N. Beller-Simms, H. Ingram, D. Feldman, N. J. Mantua, K. L. Jacobs and A. M. Waple, 65-100. Vol. Synthesis and Assessment Product 5.3. Asheville, NC: NOAA's National Climatic Data Center, 2008.
- 15. [209] Hightower, M., and S. A. Pierce. "The Energy Challenge." Nature 452, no. 7185 (2008): 285-286.
- 16. [210] Wilbanks, T. J., and al.et. "Conclusions and Research Priorities." In Effects of Climate Change on Energy Production and Use in the United States, edited by T. J. Wilbanks, V. Bhatt, D. E. Bilello, S. R. Bull, J. Ekmann, W. C. Horak, Y. J. Huang, M. D. Levine, M. J. Sale, D. K. Schmalzer et al., 98-108. Vol. Synthesis and Assessment Product 4.5. Washington, D.C.: U.S. Climate Change Science Program, 2007.
- 17. [211] Maulbetsch, J. S., and M. N. DiFilippo. Cost and Value of Water Use at Combined Cycle Power Plants. California Energy Commission, PIER Energy-Related Environmental Research, 2006.
- 18. [212] Administration, Energy Information U. S.. National Trends in Coal Transportation. Washington, D.C.: U.S. Energy Information Administration, 2002.
- 19. a. b. [68] Gutowski, W. J., G. C. Hegerl, G. J. Holland, T. R. Knutson, L. Mearns, R. J. Stouffer, P. J. Webster, M. F. Wehner, and F. W. Zwiers. "Causes of Observed Changes in Extremes and Projections of Future Changes." In Weather and Climate Extremes in a Changing Climate: Regions of Focus: North America, Hawaii, Caribbean, and U.S. Pacific Islands, edited by T. R. Karl, G. A. Meehl, C. D. Miller, S. J. Hassol, A. M. Waple and W. L. Murray, 81-116. Vol. Synthesis and Assessment Product 3.3. Washington, D.C.: U.S. Climate Change Science Program, 2008.
- 20. [112] Kunkel, K., P. D. Bromirski, H. E. Brooks, T. Cavazos, A. V. Douglas, D. R. Easterling, K. Emanuel, P.Ya. Groisman, G. J. Holland, T. R. Knutson et al. "Observed Changes in Weather and Climate Extremes." In Weather and Climate Extremes in a Changing Climate: Regions of Focus: North America, Hawaii, Caribbean, and U.S. Pacific Islands, edited by T. R. Karl, G. A. Meehl, C. D. Miller, S. J. Hassol, A. M. Waple and W. L. Murray, 35-80. Vol. CCSP Synthesis and Assessment Product 3.3. Washington, D.C.: U.S. Climate Change Science Program, 2008.
- 21. [213] Center, NOAA's National Climatic Data. Midwestern U.S. Flood Overview., 2008.
- 22. [216] Administration, Energy Information U. S.. "[data]: assembled by Evan Mills, Lawrence Berkeley National Laboratory." (Submitted).
- 23. [214] Macroeconomic and Budgetary Effects of Hurricanes Katrina and Rita In Statement of Douglas Holtz-Easkin, Director before the Committee on the Budget. U.S. House of Representatives. Washington, D.C.: Congressional Budget Office, 2005.
- 24. [215] Potter, J. R., V. R. Burkett, and M. J. Savonis. "Executive Summary." In Impacts of Climate Change and Variability on Transportation Systems and Infrastructure: Gulf Coast Study, Phase I, edited by M. J. Savonis, V. R. Burkett and J. R. Potter, ES-1 to ES-10. Vol. Synthesis and Assessment Product 4.7. Washington, D.C.: U.S. Department of Transportation, 2008.
- 25. [217] Kafalenos, R. S., K. J. Leonard, D. M. Beagan, V. R. Burkett, B. D. Keim, A. Meyers, D. T. Hunt, R. C. Hyman, M. K. Maynard, B. Fritsche et al. "What are the Implications of Climate Change and Variability for Gulf Coast Transportation?" In Impacts of Climate Change and Variability on Transportation Systems and Infrastructure: Gulf Coast Study, Phase I, edited by M. J. Savonis, V. R. Burkett and J. R. Potter, 4-1 to 4F-27 [104 pp.]. Vol. Synthesis and Assessment Product 4.7. Washington, D.C.: U.S. Department of Transportation, 2008.
- 26. [218] Administration, Energy Information U. S.. Monthly Energy Review. Washington, D.C.: U.S. Department of Energy, 2008.
- 27. [219] Team, National Assessment Synthesis. Climate Change impacts on the United States: The Potential Consequences of Climate Variability and Change. Cambridge, UK and New York, NY, 2001.
- 28. [220] ACIA. Impacts of a Warming Arctic: Arctic Climate Impact Assessment. Cambridge, UK and New York, NY: Cambridge University Press, 2004.