The content of this website is no longer being updated. For information on current assessment activities, please visit http://www.globalchange.gov/what-we-do/assessment
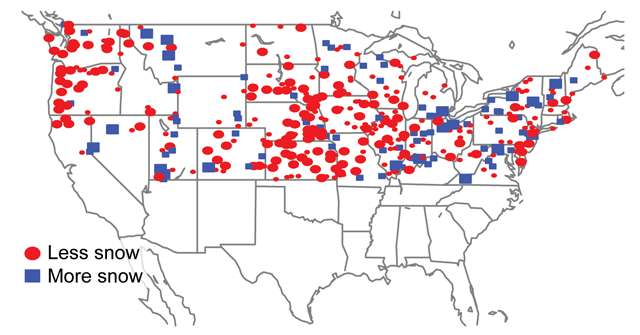
Changes in Snowfall Contribution to Wintertime Precipitation 1949 to 2005

Trends in winter snow-to-total precipitation ratio from 1949 to 2005. Red circles indicate less snow, while blue squares indicate more snow. Large circles and squares indicate the most significant trends.1 Areas south of 37ºN latitude were excluded from the analysis because most of that area receives little snowfall. White areas above that line have inadequate data for this analysis. Image Reference: Feng and Hu1
References
- 1. a. b. [143] Feng, S., and Q. Hu. "Changes in Winter Snowfall/Precipitation Ratio in the Contiguous United States." Journal of Geophysical Research-Atmospheres 112 (2007): -.
Summary
| High-resolution | High-resolution JPEG |
|---|---|
| Image Source | Feng and Hu |