The content of this website is no longer being updated. For information on current assessment activities, please visit http://www.globalchange.gov/what-we-do/assessment
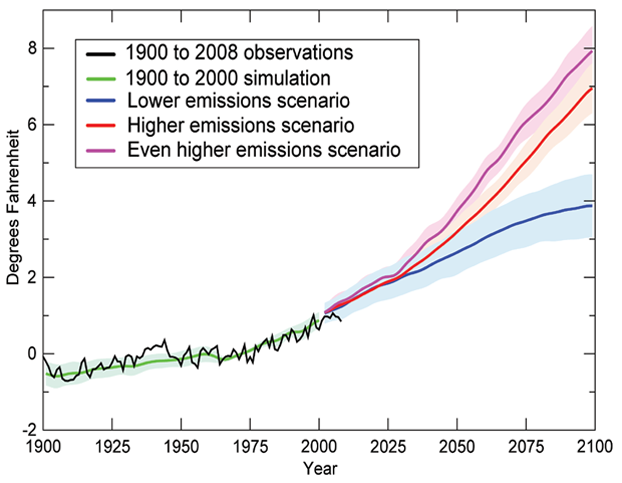
Global Average Temperature 1900 to 2100

Observed and projected changes in the global average temperature under three IPCC no-policy emissions scenarios. The shaded areas show the likely ranges while the lines show the central projections from a set of climate models. A wider range of model types shows outcomes from 2 to 11.5ºF.1 Changes are relative to the 1960-1979 average. Image References: Smith et al.2; CMIP3-A3
References
- 1. [90] Meehl, G. A., T. F. Stocker, W. D. Collins, P. Friedlingstein, A. T. Gaye, JM Gregory, A. Kitoh, R. Knutti, J. M. Murphy, A. Noda et al. "Global Climate Projections." In Climate Change 2007: The Physical Basis, edited by S. Solomon, D. Qin, M. Manning, Z. Chen, M. Marquis, K. B. Averyt, M. Tignor and H. L. Miller, 747-845. Vol. Contribution of Working Group I to the Fourth Assessment Report of the Intergovernmental Panel on Climate Change. Cambridge, UK and New York, NY: Cambridge University Press, 2007.
- 2. [72] Smith, T. M., R. W. Reynolds, T. C. Peterson, and J. Lawrimore. "Improvements to NOAA's Historical Merged Land-Ocean Surface Temperature Analysis (1880-2006)." Journal of Climate 21, no. 10 (2008): 2283-2296.
- 3. [93] various. footnote 93., 2009.
Summary
| High-resolution | High-resolution JPEG |
|---|