The content of this website is no longer being updated. For information on current assessment activities, please visit http://www.globalchange.gov/what-we-do/assessment
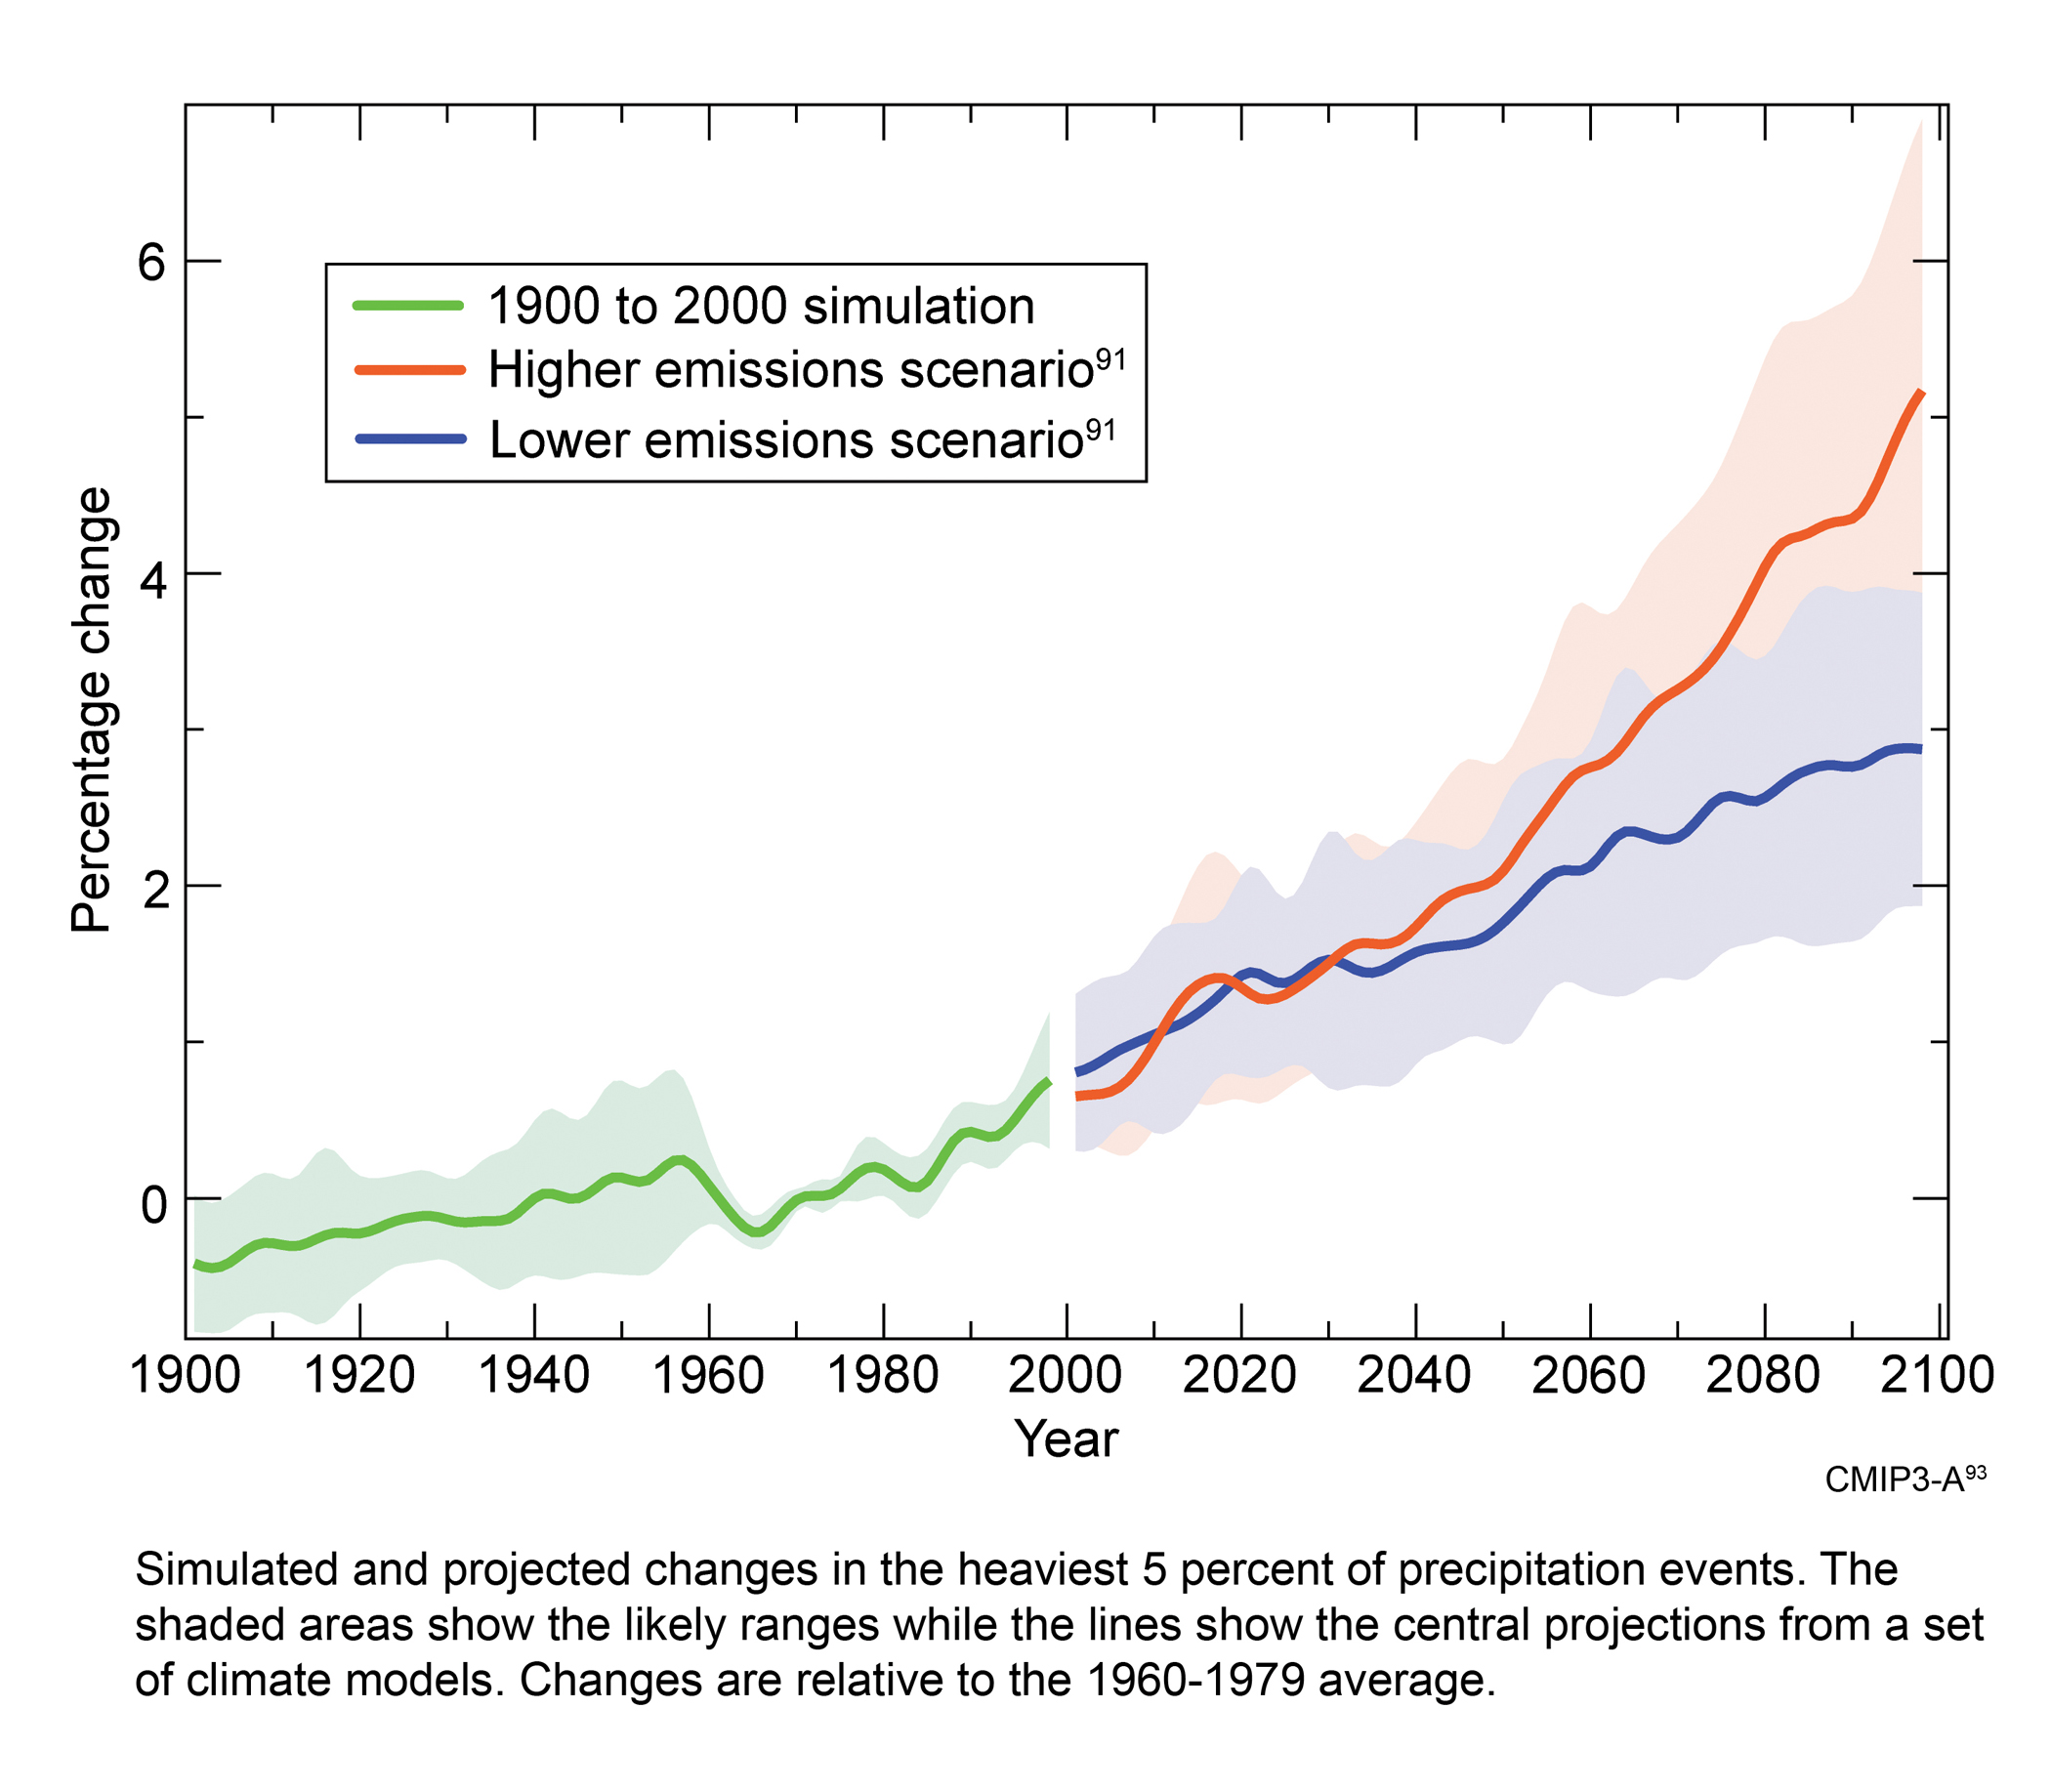
Global Increase in Heavy Precipitation 1900-2100

Simulated and projected changes in the amount of precipitation falling in the heaviest 5 percent of daily events. The shaded areas show the likely ranges while the lines show the central projections from a set of climate models. Changes are relative to the 1960-1979 average. Image Reference: CMIP3-A1
References
- 1. [93] various. footnote 93., 2009.
Summary
| High-resolution | High-resolution JPEG |
|---|