The content of this website is no longer being updated. For information on current assessment activities, please visit http://www.globalchange.gov/what-we-do/assessment
Global Temperature and Carbon Dioxide

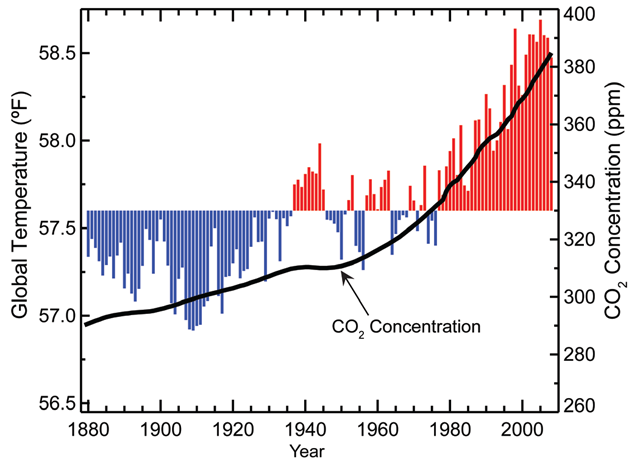
Global annual average temperature (as measured over both land and oceans). Red bars indicate temperatures above and blue bars indicate temperatures below the average temperature for the period 1901-2000. The black line shows atmospheric carbon dioxide (CO2) concentration in parts per million (ppm). While there is a clear long-term global warming trend, each individual year does not show a temperature increase relative to the previous year, and some years show greater changes than others.1 These year-to-year fluctuations in temperature are due to natural processes, such as the effects of El Niños, La Niñas, and the eruption of large volcanoes. Image Reference: NOAA/NCDC2
References
- 1. [33] Easterling, David R., and Michael F. Wehner. "Is the climate warming or cooling?" Geophysical Research Letters 36 (2009).
- 2. [32] various. footnote 32., 2009.
Summary
| High-resolution | High-resolution JPEG |
|---|