The content of this website is no longer being updated. For information on current assessment activities, please visit http://www.globalchange.gov/what-we-do/assessment
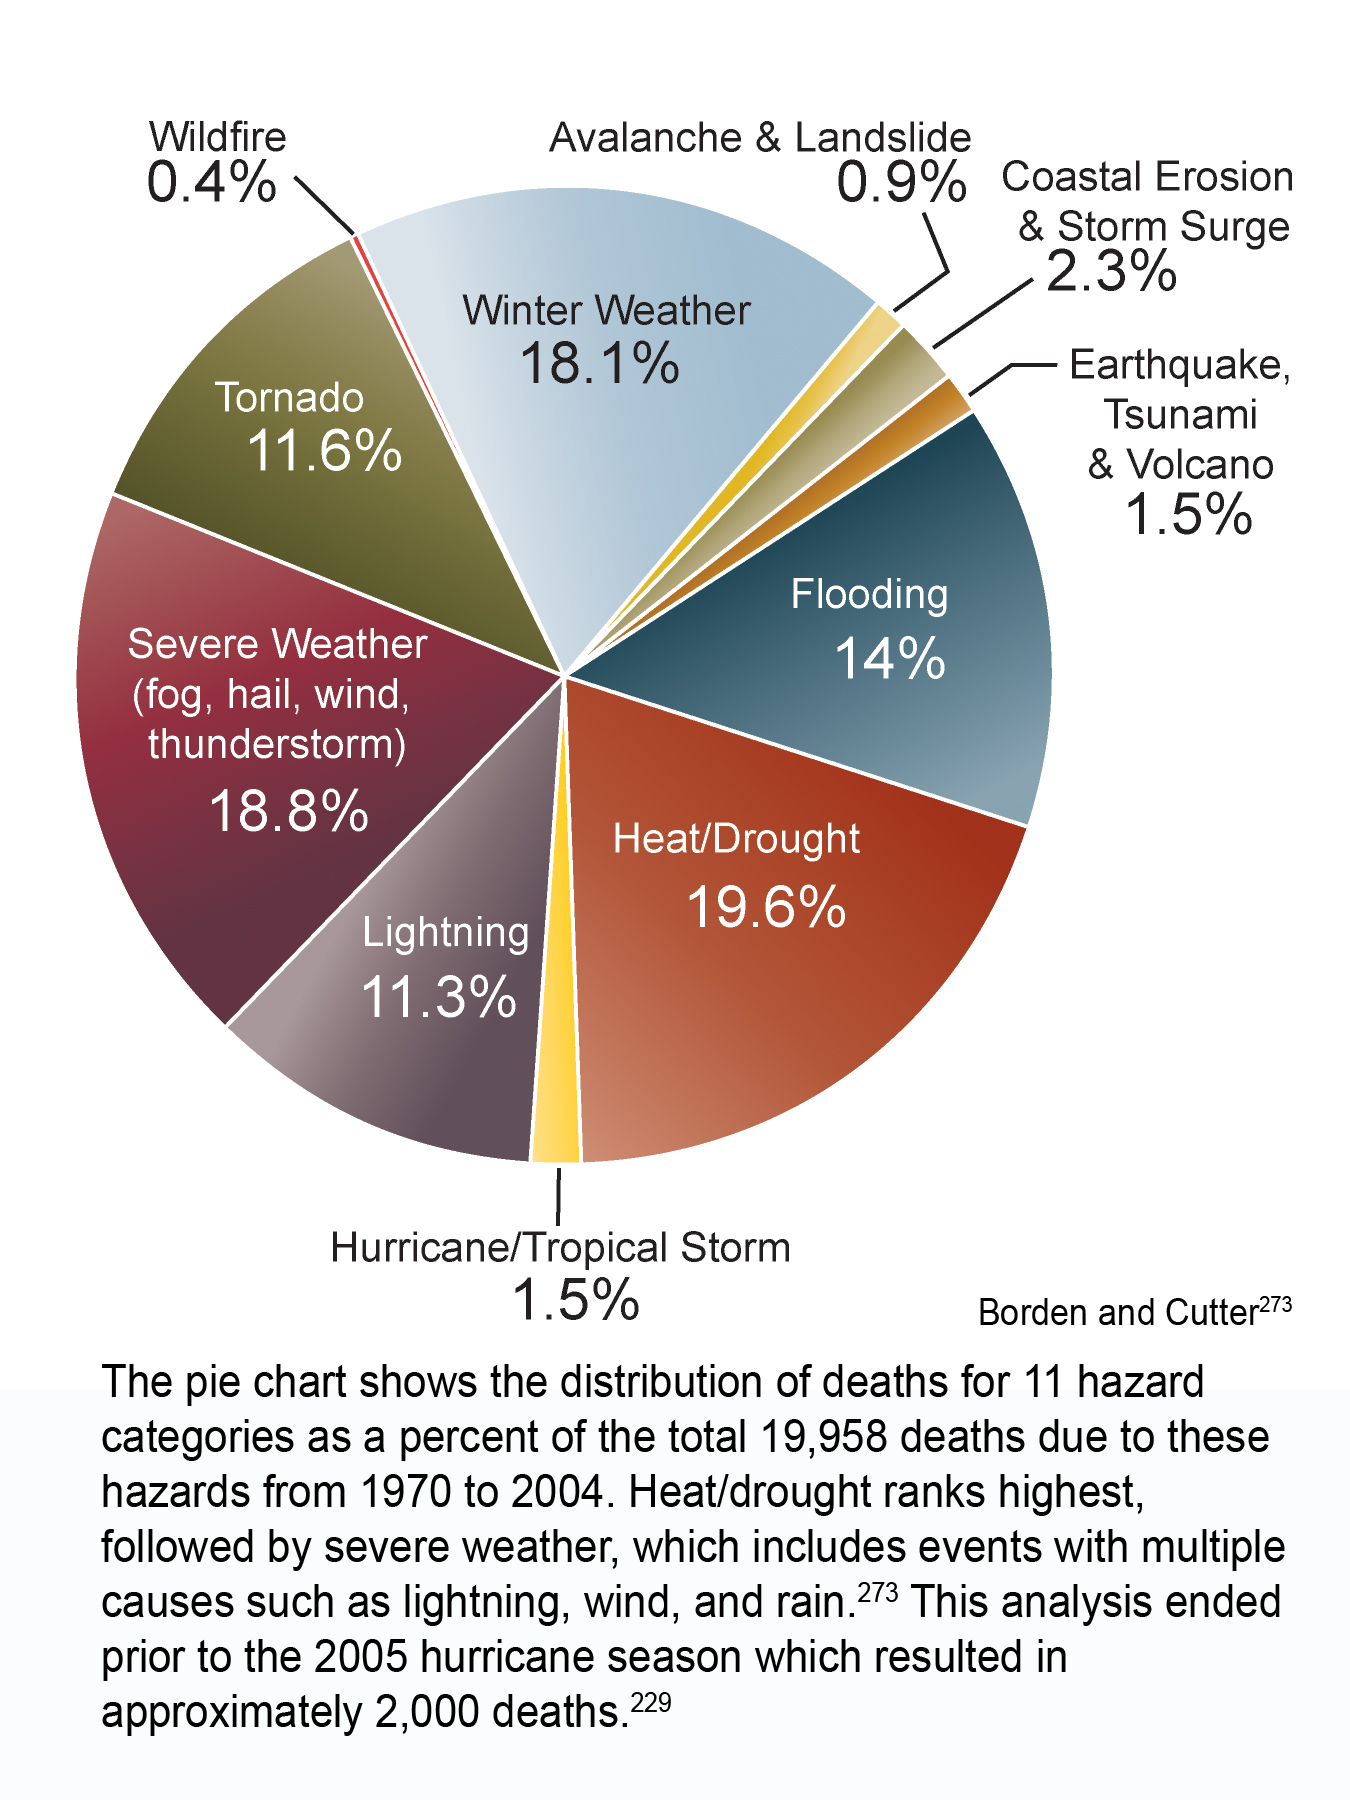
Hazard-Related Deaths in the U.S.

The pie chart shows the distribution of deaths for 11 hazard categories as a percent of the total 19,958 deaths due to these hazards from 1970 to 2004. Heat/drought ranks highest, followed by severe weather, which includes events with multiple causes such as lightning, wind, and rain.1 This analysis ended prior to the 2005 hurricane season which resulted in approximately 2,000 deaths.2 Image Reference: Borden and Cutter1
References
- 1. a. b. [273] Borden, K. A., and S. L. Cutter. "Spatial Patterns of Natural Hazards Mortality in the United States." International Journal of Health Geographics 7 (2008): 13 pp.
- 2. [229] Center, NOAA's National Climatic Data. Billion Dollar U.S. Weather Disasters., 2008.
Summary
| High-resolution | High-resolution JPEG |
|---|