The content of this website is no longer being updated. For information on current assessment activities, please visit http://www.globalchange.gov/what-we-do/assessment
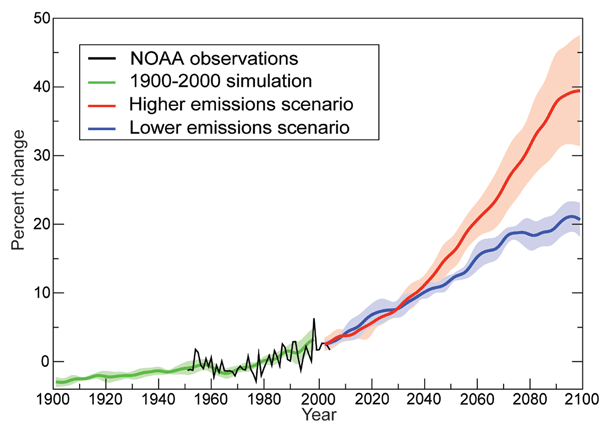
Increase in Percent of Very Warm Nights

The graph shows the observed and projected change in percent of very warm nights from the 1950-1990 average in the United States. Under the lower emissions scenario,1 the percentage of very warm nights is projected to increase about 20 percent by 2100. Under the higher emissions scenario,1 it is projected to increase by about 40 percent.2 The shaded areas show the likely ranges while the lines show the central projections from a set of climate models. The projections appear smooth because they show the calculated average of many models. Image Source: adapted from CCSP SAP 3.32
References
- 1. a. b. [91] various. footnote 91., 2009.
- 2. a. b. [68] Gutowski, W. J., G. C. Hegerl, G. J. Holland, T. R. Knutson, L. Mearns, R. J. Stouffer, P. J. Webster, M. F. Wehner, and F. W. Zwiers. "Causes of Observed Changes in Extremes and Projections of Future Changes." In Weather and Climate Extremes in a Changing Climate: Regions of Focus: North America, Hawaii, Caribbean, and U.S. Pacific Islands, edited by T. R. Karl, G. A. Meehl, C. D. Miller, S. J. Hassol, A. M. Waple and W. L. Murray, 81-116. Vol. Synthesis and Assessment Product 3.3. Washington, D.C.: U.S. Climate Change Science Program, 2008.
Summary
| High-resolution | High-resolution JPEG |
|---|