The content of this website is no longer being updated. For information on current assessment activities, please visit http://www.globalchange.gov/what-we-do/assessment
Long Term Aridity Changes in the West

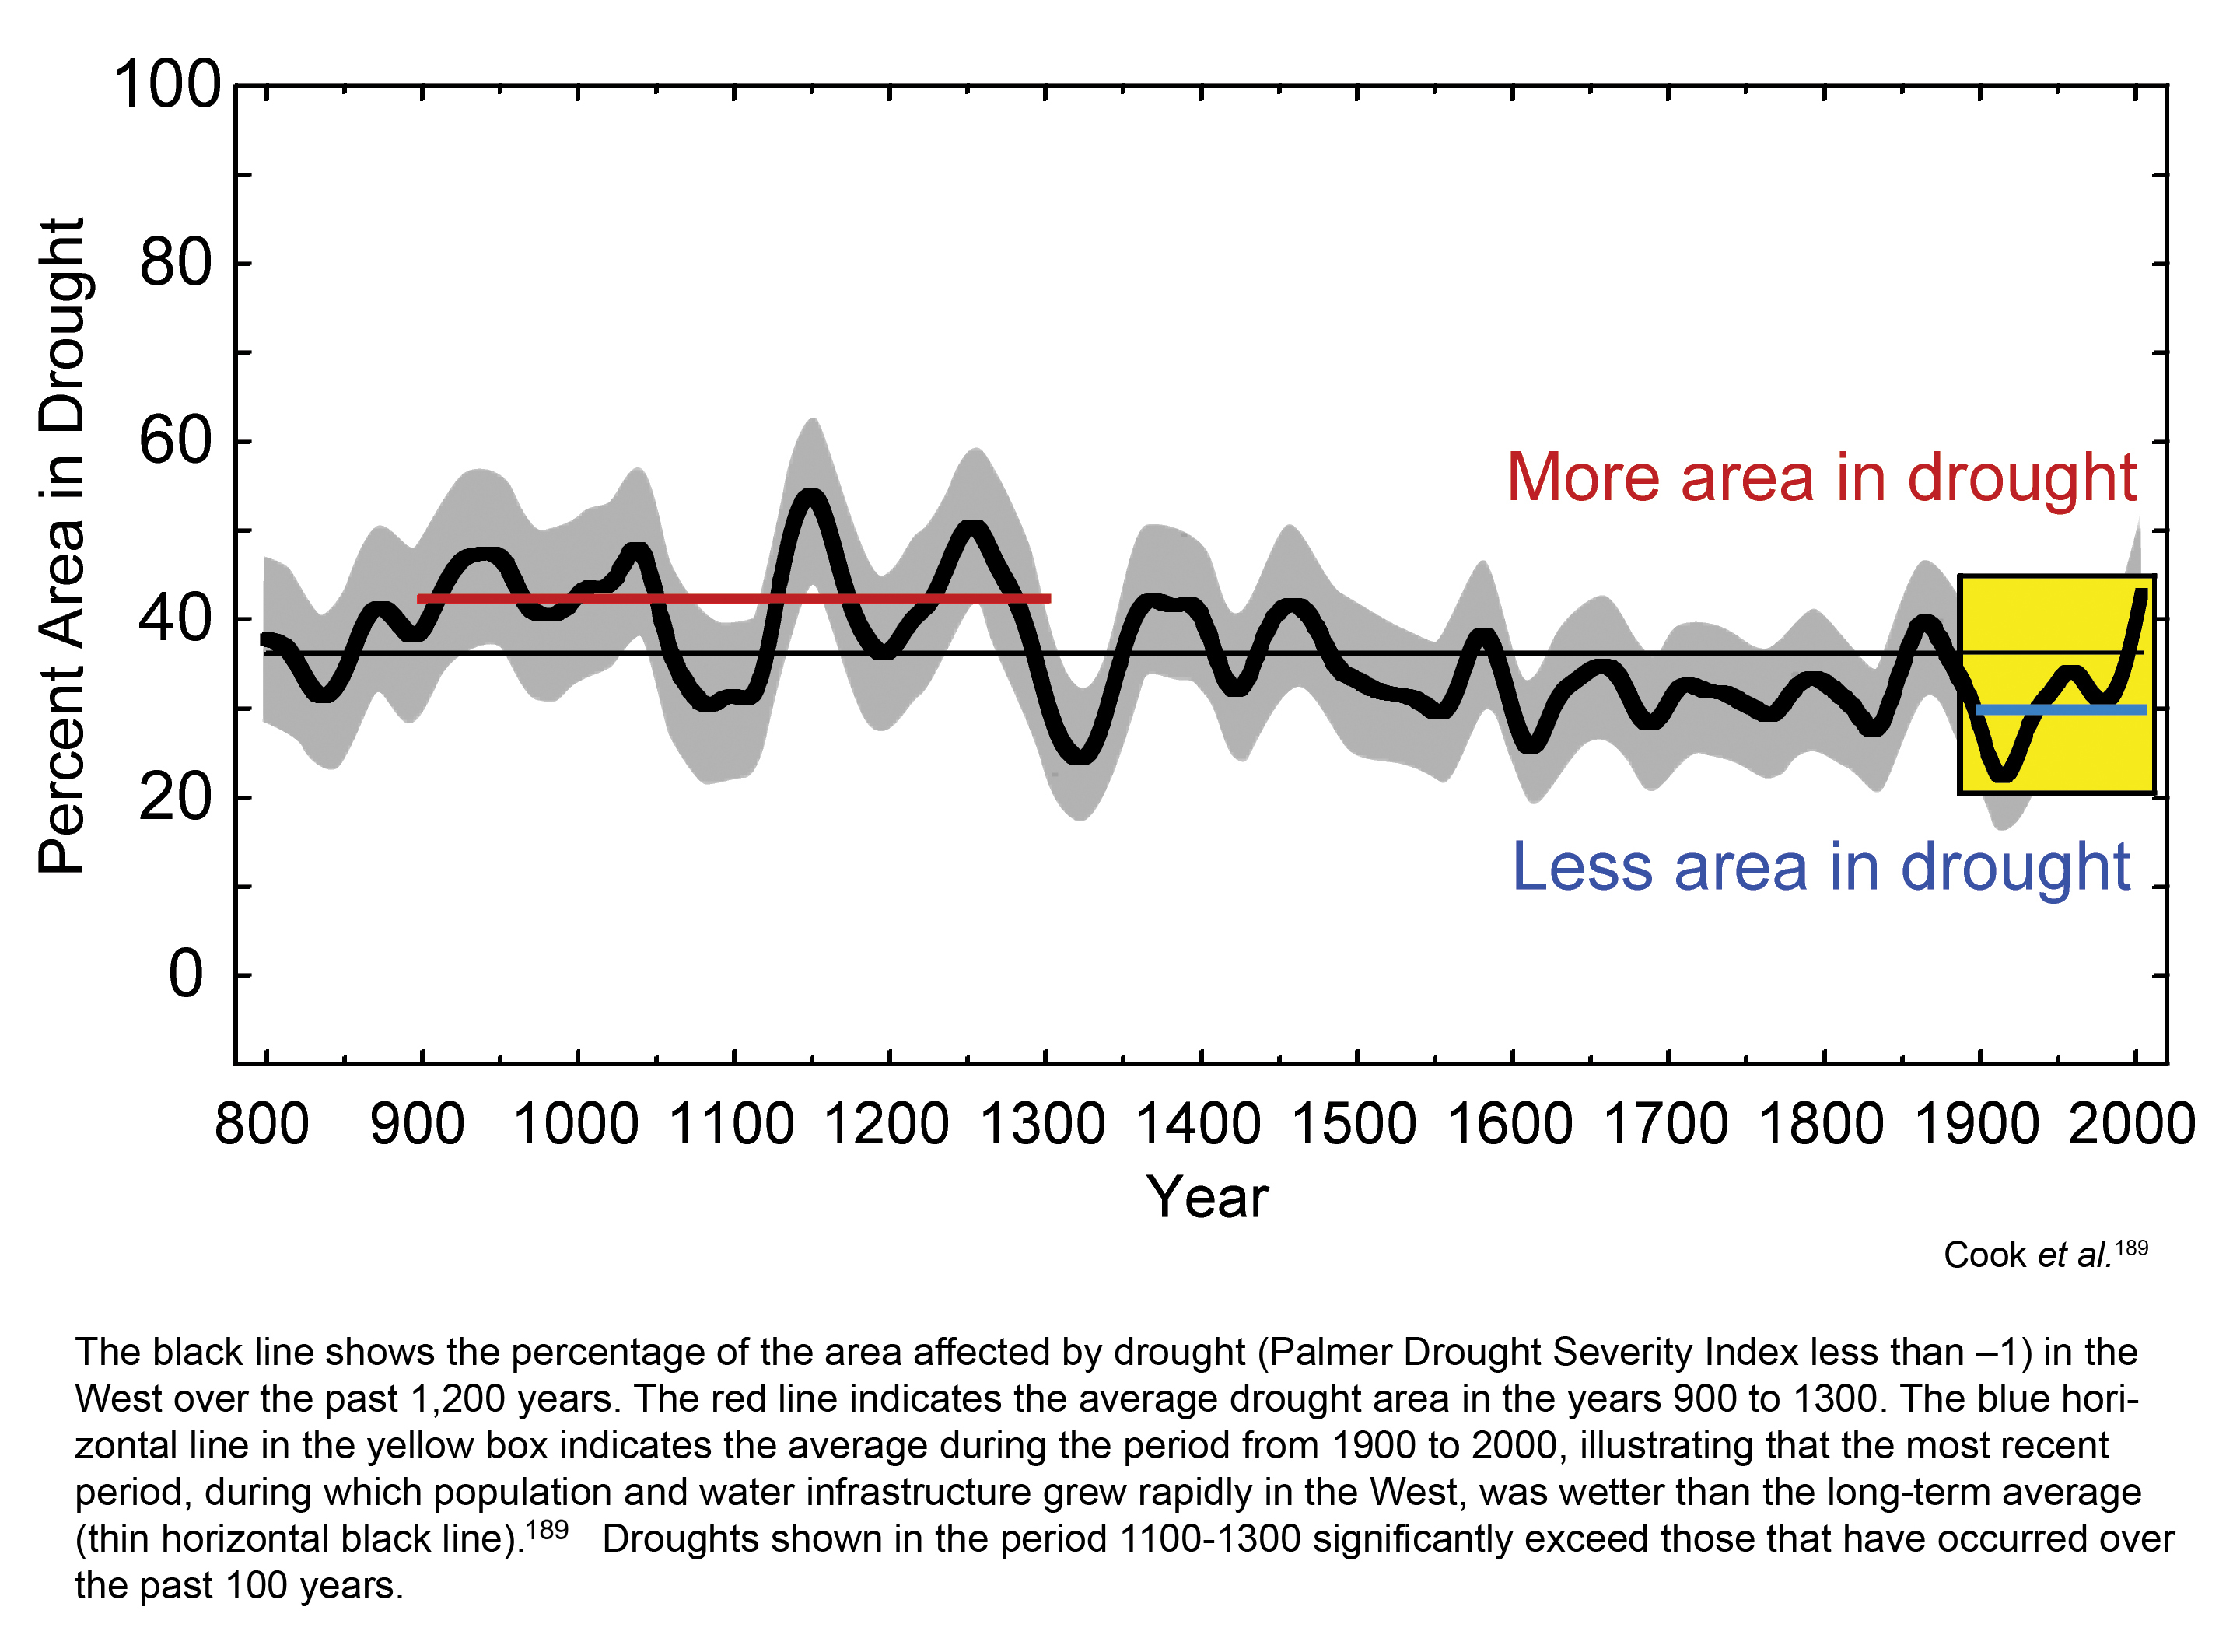
The black line shows the percentage of the area affected by drought (Palmer Drought Severity Index less than –1) in the West over the past 1,200 years. The red line indicates the average drought area in the years 900 to 1300. The blue horizontal line in the yellow box indicates the average during the period from 1900 to 2000, illustrating that the most recent period, during which population and water infrastructure grew rapidly in the West, was wetter than the long-term average (thin horizontal black line).1 Droughts shown in the period 1100-1300 significantly exceed those that have occurred over the past 100 years. Image Reference: Cook et al.1
References
- 1. a. b. [189] Cook, E. R., CA Woodhouse, C. M. Eakin, D. M. Meko, and D. W. Stahle. "Long-term Aridity Changes in the Western United States." Science 306, no. 5698 (2004): 1015-1018.
Summary
| High-resolution | High-resolution JPEG |
|---|