The content of this website is no longer being updated. For information on current assessment activities, please visit http://www.globalchange.gov/what-we-do/assessment
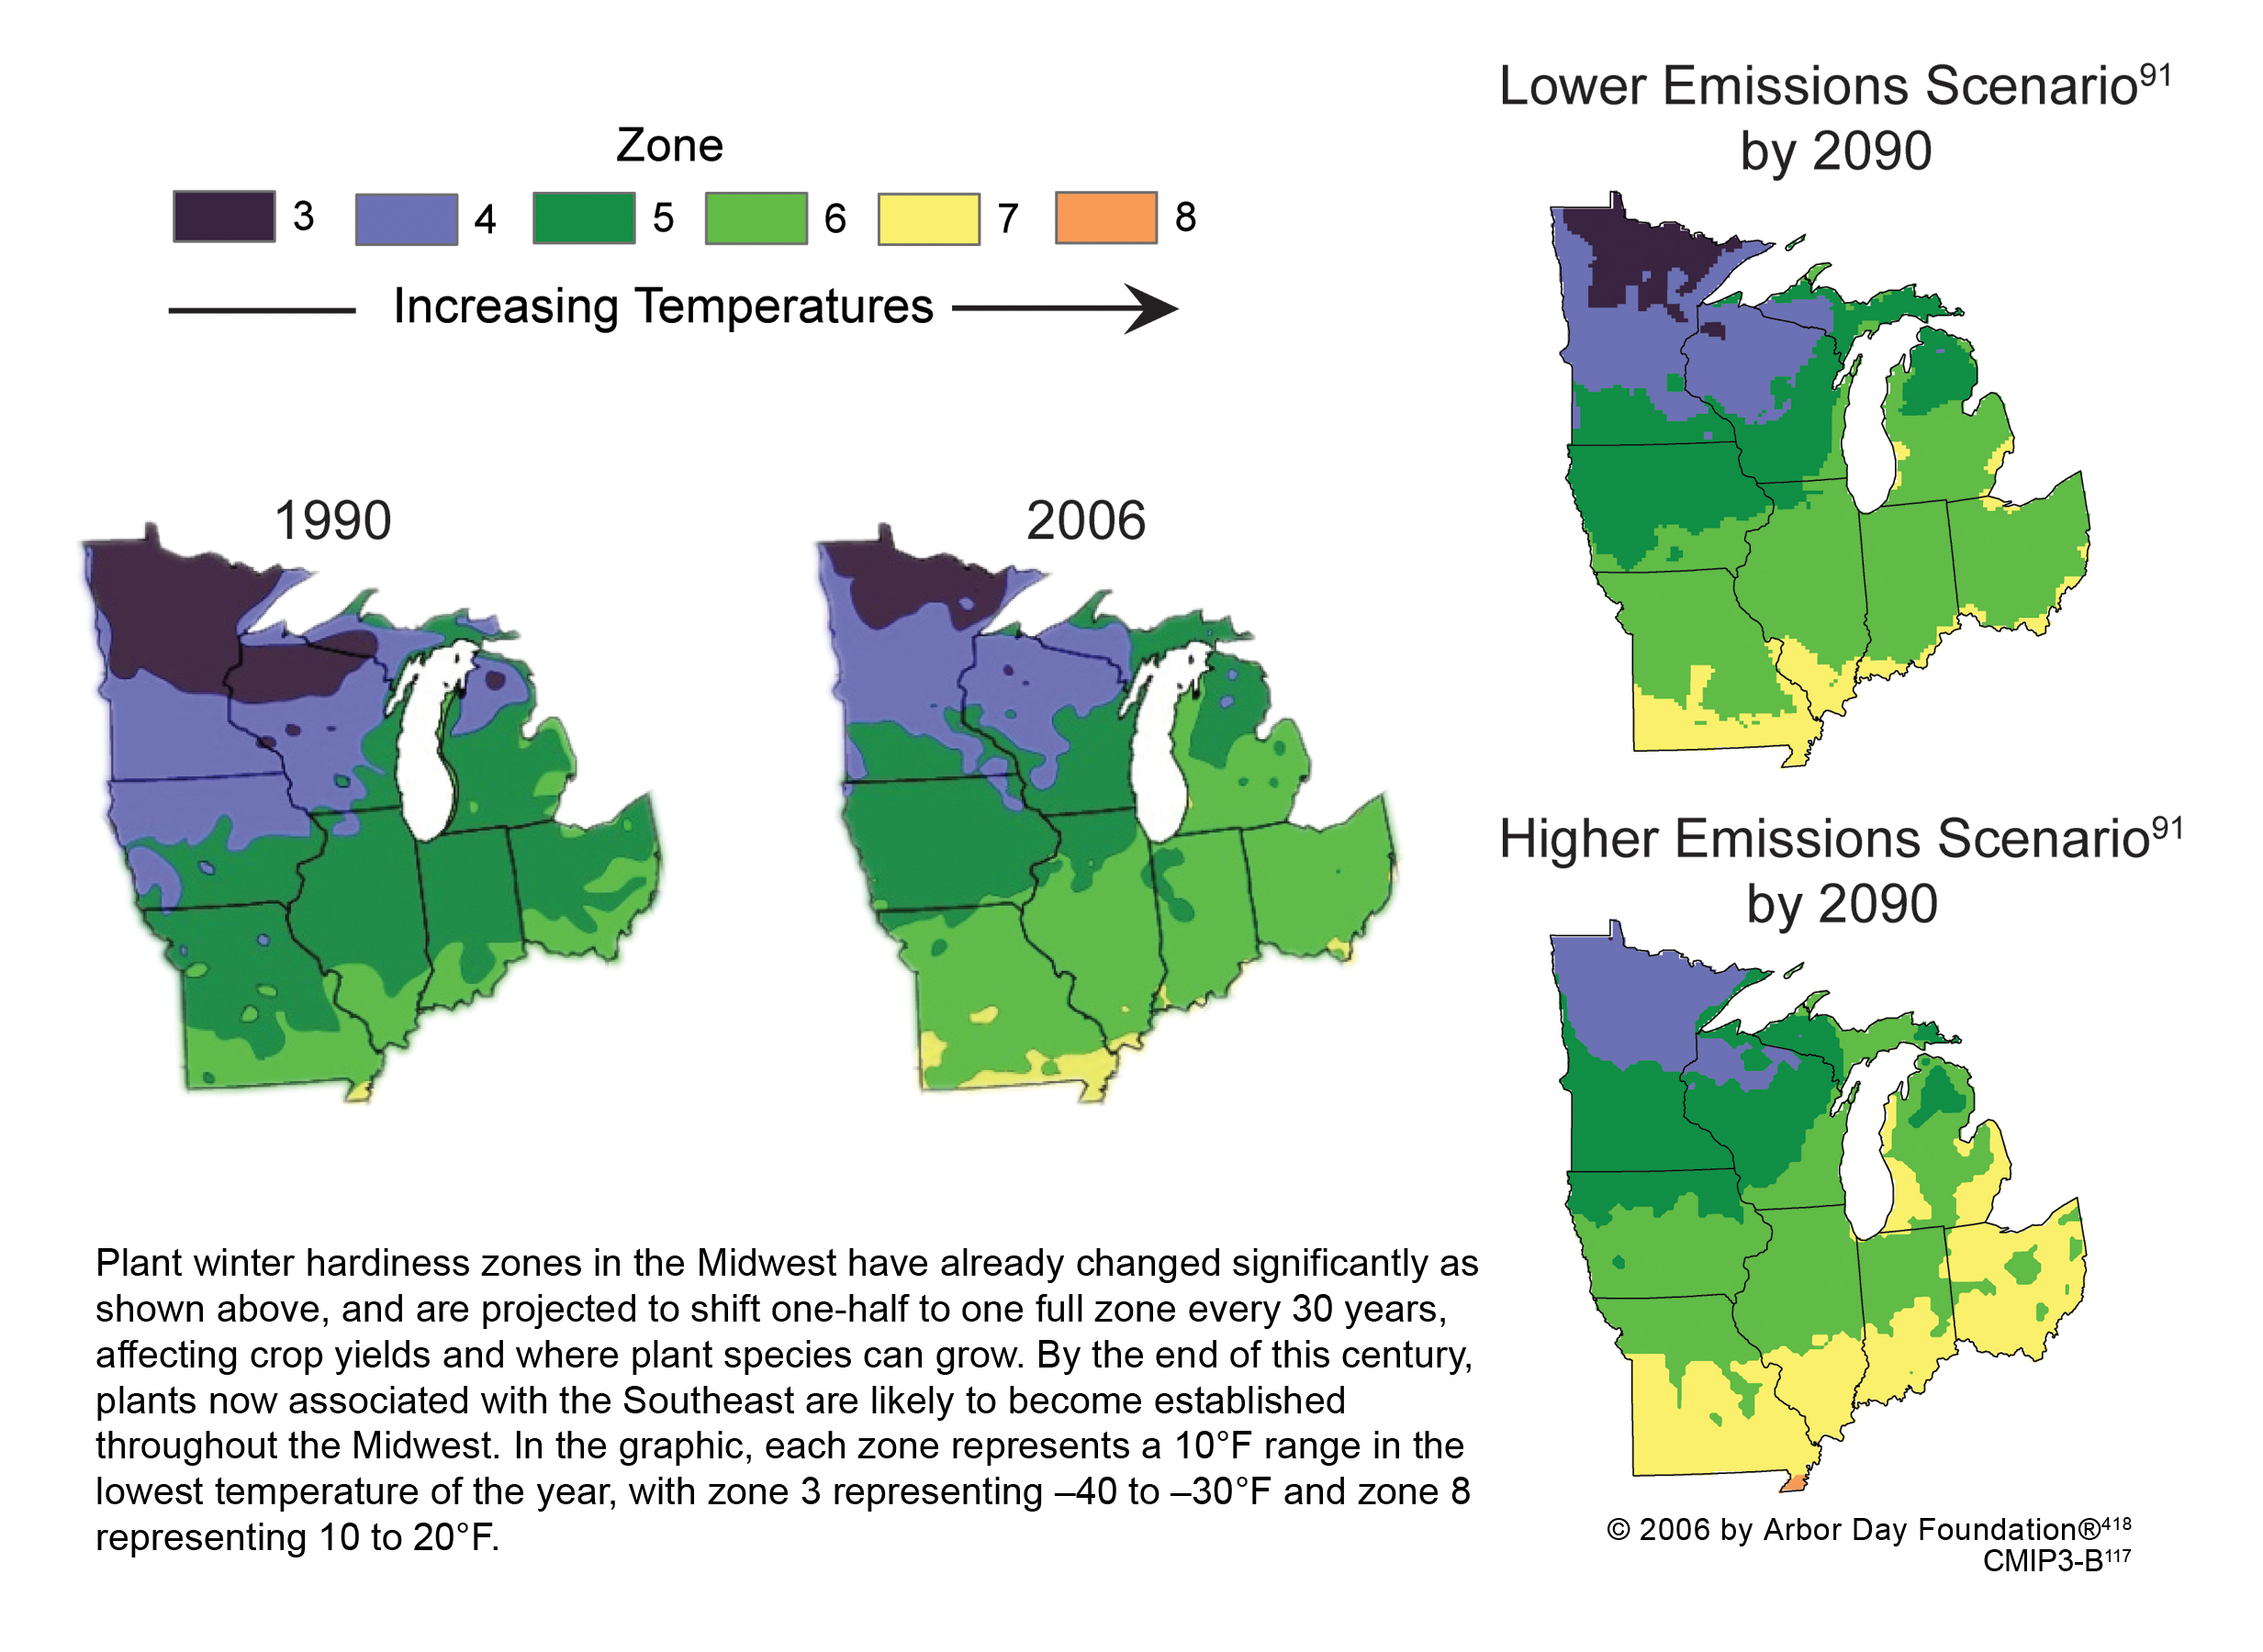
Observed and Projected Changes in Plant Hardiness Zones

Plant winter hardiness zones in the Midwest have already changed significantly as shown above, and are projected to shift one-half to one full zone every 30 years, affecting crop yields and where plant species can grow. By the end of this century, plants now associated with the Southeast are likely to become established throughout the Midwest. In the graphic, each zone represents a 10°F range in the lowest temperature of the year, with zone 3 representing –40 to –30°F and zone 8 representing 10 to 20°F. Image Source: © 2006 by Arbor Day Foundation®1; Image Reference: CMIP3-B2
References
- 1. [418] various. footnote 418., 2009.
- 2. [117] various. footnote 117., 2009.
Summary
| High-resolution | High-resolution JPEG |
|---|