The content of this website is no longer being updated. For information on current assessment activities, please visit http://www.globalchange.gov/what-we-do/assessment
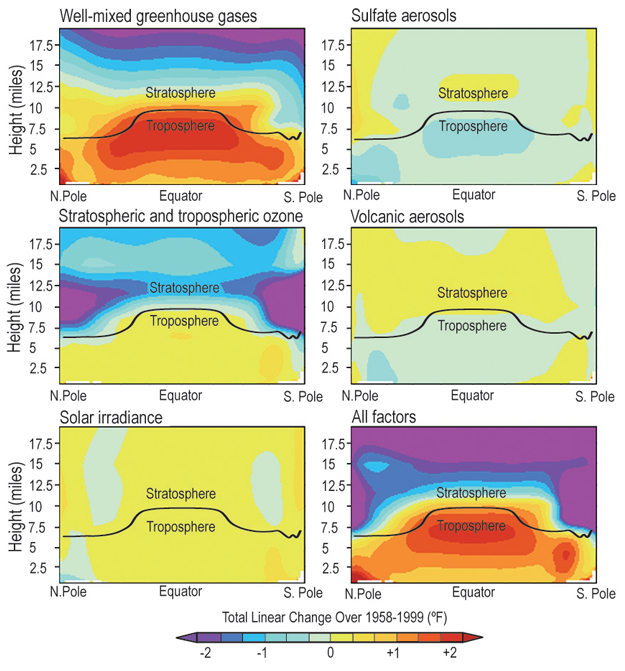
Patterns of Temperature Change Produced by Various Atmospheric Factors, 1958-1999

Climate simulations of the vertical profile of temperature change due to various factors, and the effect due to all factors taken together. The panels above represent a cross-section of the atmosphere from the north pole to the south pole, and from the surface up into the stratosphere. The black lines show the location of the tropopause, the boundary between the lower atmosphere (troposphere) and the stratosphere. Image Source: modified from CCSP SAP 1.11
References
- 1. [63] Ramaswamy, V., J. W. Hurrell, G. A. Meehl, A. Phillips, B. D. Santer, M. D. Schwarzkopf, D. J. Seidel, S. C. Sherwood, and P. W. Thorne. "Why Do Temperatures Vary Vertically (from the Surface to the Stratosphere) and What Do We Understand About Why They Might Vary and Change Over Time?" In Temperature Trends in the Lower Atmosphere: Steps for Understanding and Reconciling Differences, edited by T. R. Karl, S. J. Hassol, C. D. Miller and W. L. Murray, 15-28. Vol. Synthesis and Assessment Product 1.1. Washington, D.C.: U.S. Climate Change Science Program, 2006.
Summary
| High-resolution | High-resolution JPEG |
|---|