The content of this website is no longer being updated. For information on current assessment activities, please visit http://www.globalchange.gov/what-we-do/assessment
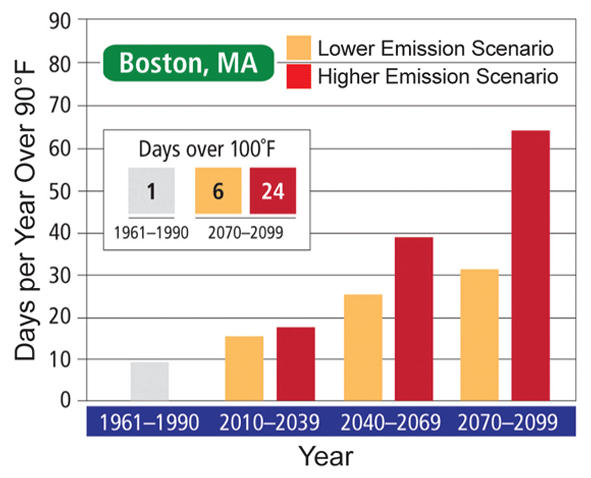
Projected Days per Year over 90°F in Boston

The graph shows model projections of the number of summer days with temperatures over 90°F in Boston, Massachusetts, under lower and higher (referred to as “even higher” in figure from Global Climate Change section) emissions scenarios.1 The inset shows projected days over 100°F.2 Image Reference: Hayhoe et al.2
References
- 1. [91] various. footnote 91., 2009.
- 2. a. b. [359] Hayhoe, K., C. P. Wake, B. Anderson, X. - Z. Liang, E. Maurer, J. Zhu, J. Bradbury, A. DeGaetano, A. Hertel, and D. Wuebbles. "Regional Climate Change Projections for the Northeast U.S." Mitigation and Adaptation Strategies for Global Change 13, no. 5-6 (2008): 425-436.
Summary
| High-resolution | High-resolution JPEG |
|---|