The content of this website is no longer being updated. For information on current assessment activities, please visit http://www.globalchange.gov/what-we-do/assessment
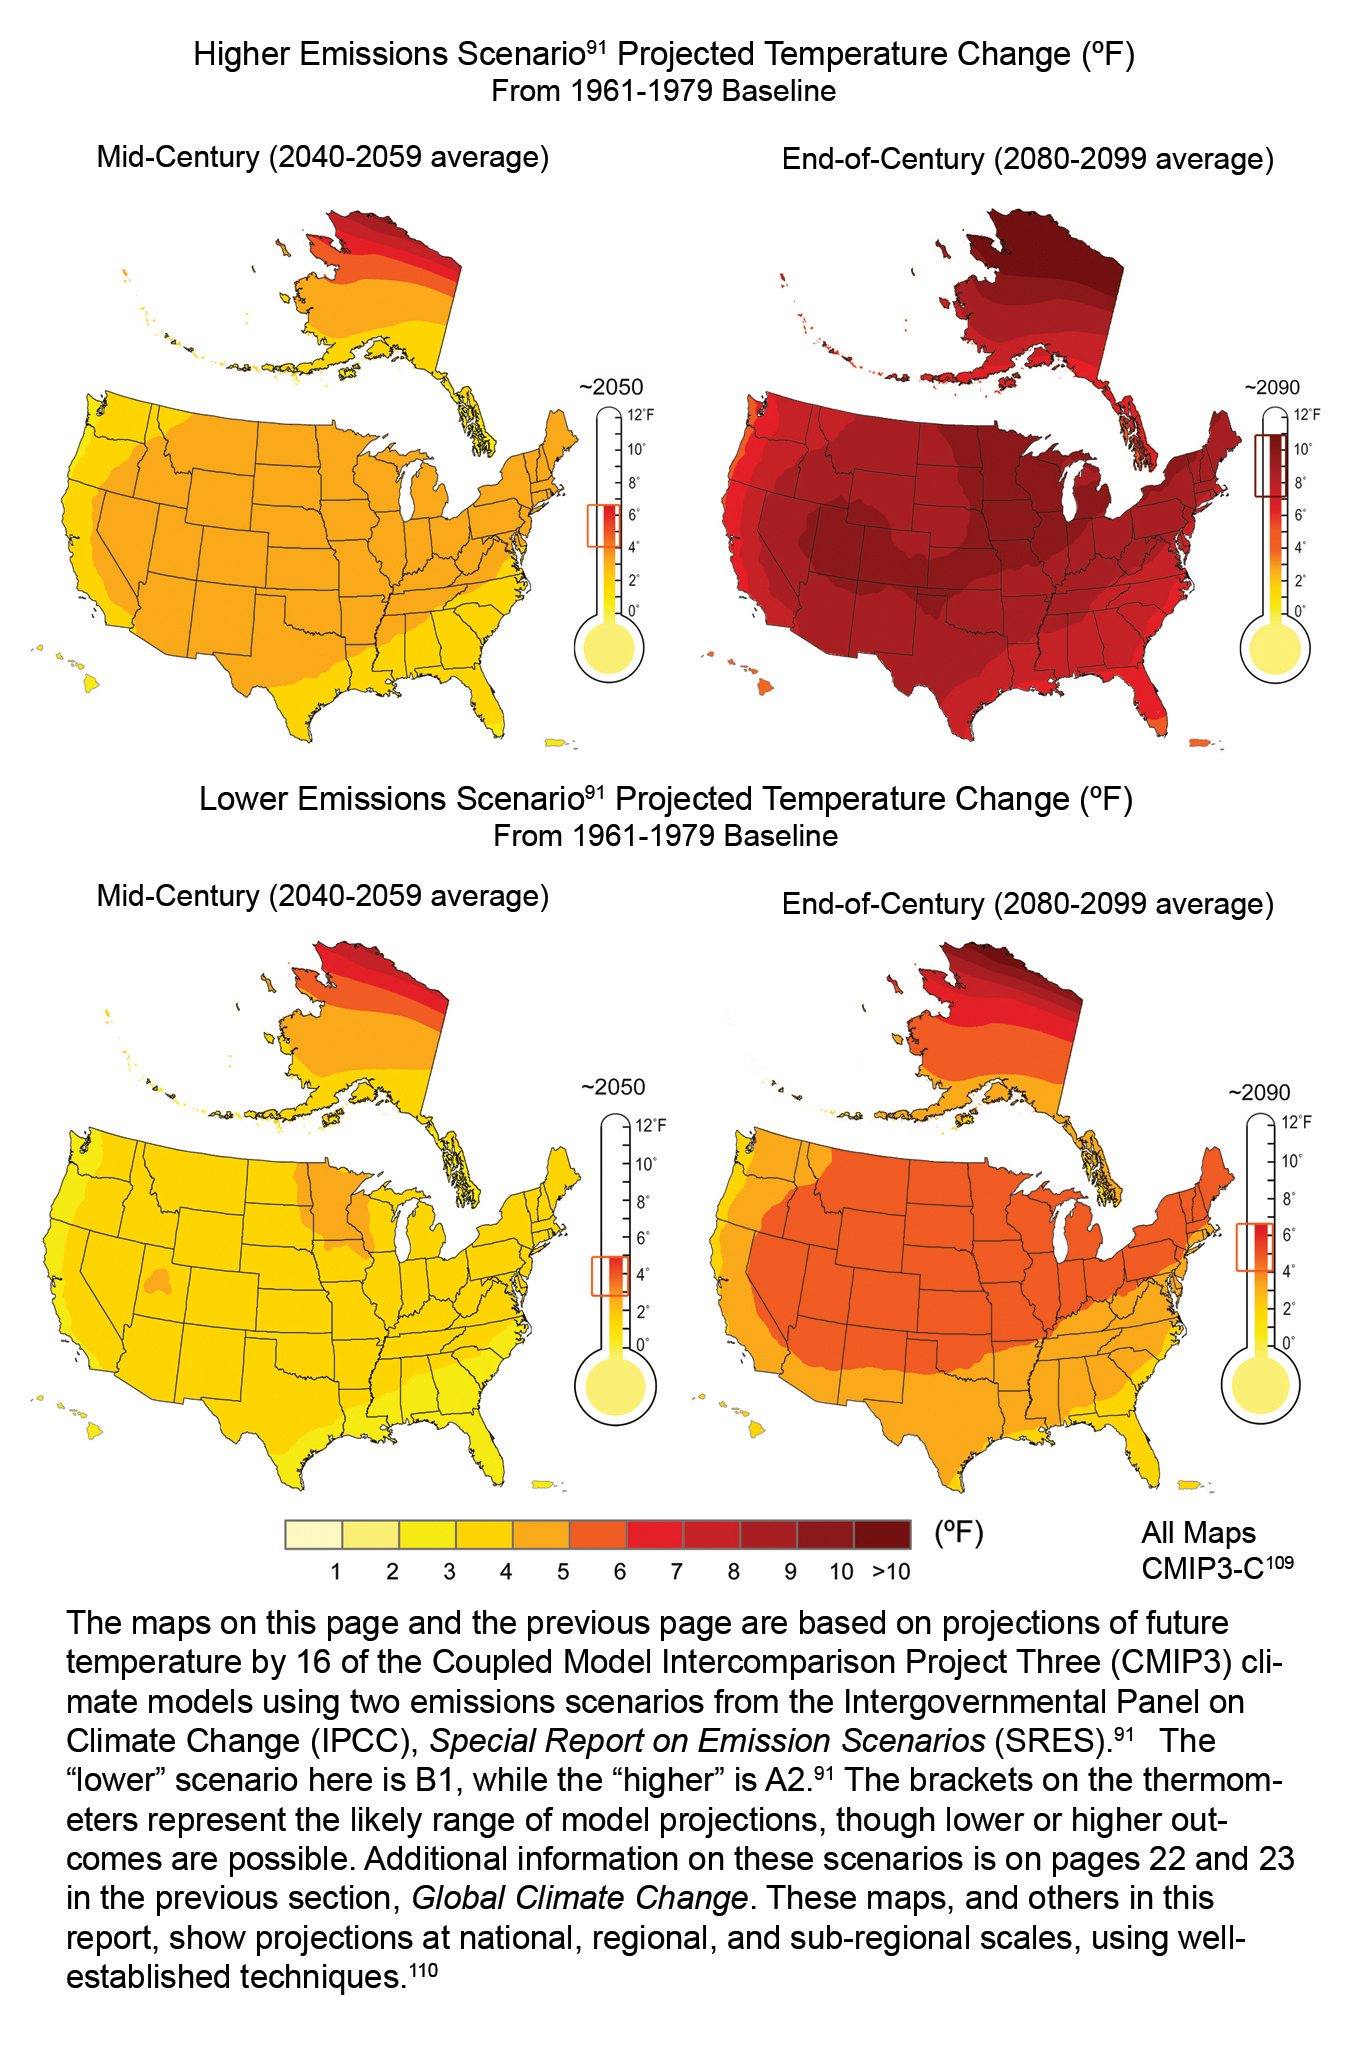
Projected Temperature Change

The maps shown here and in the figure above are based on projections of future temperature by 16 of the Coupled Model Intercomparison Project Three (CMIP3) climate models using two emissions scenarios from the Intergovernmental Panel on Climate Change (IPCC), Special Report on Emissions Scenarios (SRES).1 The “lower” scenario here is B1, while the “higher” is A2.1 The brackets on the thermometers represent the likely range of model projections, though lower or higher outcomes are possible. Additional information on these scenarios is under Emissions Scenarios in the Global Climate Change section. These maps, and others in this report, show projections at national, regional, and sub-regional scales, using well-established techniques.2 Image Reference: CMIP3-C3
References
- 1. a. b. [91] various. footnote 91., 2009.
- 2. [110] various. footnote 110., 2009.
- 3. [109] various. footnote 109., 2009.
Summary
| High-resolution | High-resolution JPEG |
|---|